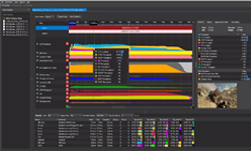
In the world of high-performance computing, it is important to understand how your code affects the operating characteristics of your HW. For example, if your program executes inefficient code, it may cause the GPU to work harder than it needs to, leading to higher power consumption, and a potential slow-down due to throttling.
A new profiling feature in CUDA 5.5 allows you to profile the clocks, power, and thermal characteristics of the GPU as it executes your code. This feature is available in the NVIDIA Visual Profiler on Linux and 64-bit Windows 7/8 and NSight Eclipse Edition on Linux. Learn how to activate and use this feature by watching CUDACasts Episode 13.
To suggest a topic for a future episode of CUDACasts, or if you have any other feedback, please leave a comment below.


