NVIDIA Nsight Eclipse Edition is a full-featured, integrated development environment that lets you easily develop CUDA applications for either your local (x86) system or a remote (x86 or Arm) target. In this post, I will walk you through the process of remote-developing CUDA applications for the NVIDIA Jetson TK1, an Arm-based development kit.
Nsight supports two remote development modes: cross-compilation and “synchronize projects” mode. Cross-compiling for Arm on your x86 host system requires that all of the Arm libraries with which you will link your application be present on your host system. In synchronize-projects mode, on the other hand, your source code is synchronized between host and target systems and compiled and linked directly on the remote target, which has the advantage that all your libraries get resolved on the target system and need not be present on the host. Neither of these remote development modes requires an NVIDIA GPU to be present in your host system.
Note: CUDA cross-compilation tools for Arm are available only in the Ubuntu 12.04 DEB package of the CUDA 6 Toolkit. If your host system is running a Linux distribution other than Ubuntu 12.04, I recommend the synchronize-projects remote development mode, which I will cover in detail in a later blog post.
CUDA toolkit setup
The first step involved in cross-compilation is installing the CUDA 6 Toolkit on your host system. To get started, let’s download the required Ubuntu 12.04 DEB package from the CUDA download page. Installation instructions can be found in the Getting Started Guide for Linux, but I will summarize them below for CUDA 6.
1. Enable armhf as a foreign architecture to get the cross-armhf packages installed:
$ sudo sh -c \ 'echo "foreign-architecture armhf" >> /etc/dpkg/dpkg.cfg.d/multiarch'
$ sudo apt-get update
- Run dpkg to install and update the repo meta-data:
$ sudo dpkg – i cuda-repo-ubuntu1204_6.0-37_amd64.deb
$ sudo apt-get update
- Install cuda cross and Arm GNU packages (these will be linked in future toolkit versions):
$ sudo apt-get install cuda-cross-armhf
$ sudo apt-get install g++-4.6-arm-linux-gnueabihf
- OPTIONAL – if you also wish to do native x86 CUDA development and have an NVIDIA GPU in your host system then you can install the full toolchain and driver:
$ sudo apt-get install cuda
Reboot your system if you installed the driver so that NVIDIA driver gets loaded. Then update paths to the toolkit install location as follows:
$ export PATH=/usr/local/cuda/bin:$PATH
$ export LD_LIBRARY_PATH=/usr/local/cuda/lib64:$LD_LIBRARY_PATH
At the end of these steps you should see armv7-linux-gnueabihf and the optional x86_64_linux folder under /usr/local/cuda/targets/.
For your cross-development needs, Jetson TK1 comes prepopulated with Linux for Tegra (L4T), a modified Ubuntu (13.04 or higher) Linux distribution provided by NVIDIA. NVIDIA provides the board support package and a software stack that includes the CUDA Toolkit, OpenGL 4.4 drivers, and the NVIDIA VisionWorks™ Toolkit. You can download all of these, as well as examples and documentation, from the Jetson TK1 Support Page.
Importing Your First Jetson TK1 CUDA Sample into Nsight
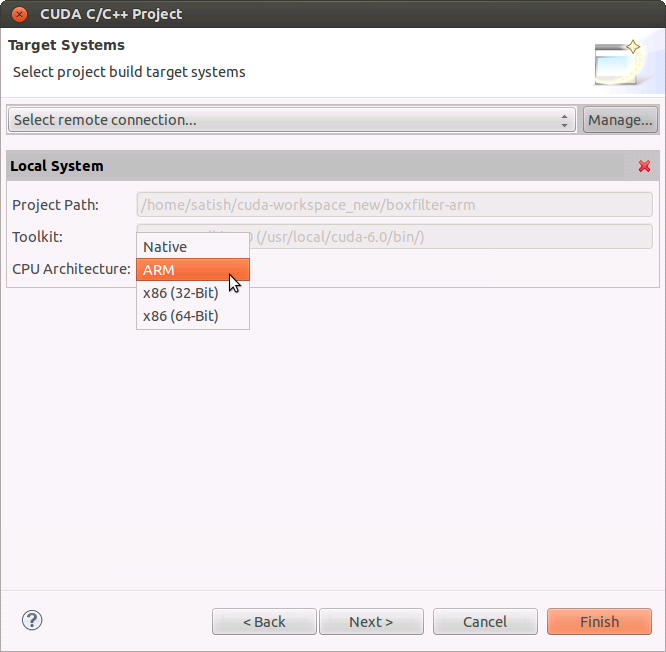
With the CUDA Toolkit installed and the paths setup on the host system, launch Nsight by typing “nsight” (without the quotes) at the command line or by finding the Nsight icon in the Ubuntu dashboard. Once Nsight is loaded, navigate to File->New->CUDA C/C++ Project and import an existing CUDA sample to start the Project Creation wizard. For the project name, enter “boxfilter-arm” and select “Import CUDA Sample” in the project type and “CUDA Toolkit 6.0” in the toolchains. Next, choose the Boxfilter sample which can be found under the Imaging category. The remaining options in the wizard let you choose which GPU and CPU architectures to generate code for. First, we will choose the GPU code that should be generated by the nvcc compiler. Since Jetson TK1 includes an NVIDIA Kepler™ GPU, choose SM32 GPU binary code and SM30 PTX intermediate code. (The latter is so that any Kepler-class GPU can run this application.) The next page in the wizard lets you decide if you wish to do native x86 development or cross-compile for an Arm system. To cross compile for Arm, choose Arm architecture in the CPU architecture drop-down box.
CUDA samples are generic code samples that can be imported and run on various hardware configurations. For this cross build exercise the Arm library dependencies used by this application has to be resolved first. Here’s how you can resolve those:
1. Right click on the project and navigate to Properties->Build->Settings->Tool Settings->NVCC Linker->Libraries and update the paths to point to linux/armv7l instead of linux/x86_64. This will resolve the libGLEW library dependencies. Also remove the entry for GLU since that library is unused.
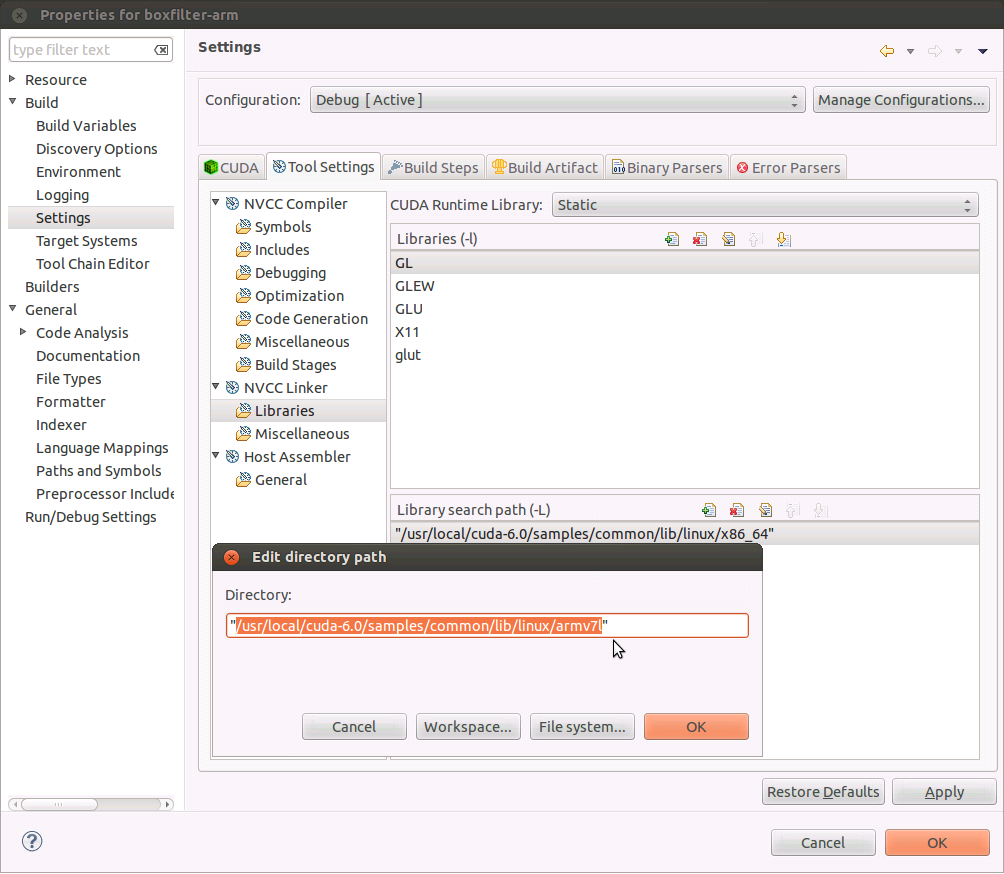
2. Click on the Miscellaneous tab and add a new -Xlinker option “—unresolved-symbols=ignore-in-shared-libs” (without the quotes).
3. In the terminal window use the scp utility to copy the remaining libraries from your Jetson TK1:
scp ubuntu@your.ip.address:/usr/lib/arm-linux-gnueabihf/libglut.so.3  /usr/arm-linux-gnueabihf/lib folder, with a symlink to libglut.so
scp ubuntu@your.ip.address:/usr/lib/arm-linux-gnueabihf/tegra/libGL.so.1 /usr/arm-linux/gnueabihf/lib folder, with a symlink to libGL.so
scp ubuntu@your.ip.address:/usr/lib/arm-linux-gnueabihf/libX11.so.6 /usr/arm-linux-gnueabihf/lib folder, with a symlink to libX11.so
Note: You need to copy these Arm libraries only for the first CUDA sample. You may need additional libraries for other samples.
The build process for Arm cross-development is similar to the local build process. Just click on the build “hammer” icon in the toolbar menu to build a debug Arm binary. As part of the compilation process, Nsight will launch nvcc for the GPU code and the arm-linux-gnueabihf-g++-4.6 cross-compiler for the CPU code as follows:
Building file: ../src/boxFilter_kernel.cu
Invoking: NVCC Compiler
/usr/local/cuda-6.0/bin/nvcc -I"/usr/local/cuda-6.0/samples/3_Imaging" -I"/usr/local/cuda-6.0/samples/common/inc"
-I"/home/satish/cuda-workspace_new/boxfilter-arm" -G -g -O0 -ccbin arm-linux-gnueabihf-g++-4.6 -gencode arch=compute_30,
code=sm_30 -gencode arch=compute_32,code=sm_32 --target-cpu-architecture ARM -m32 -odir "src" -M -o "src/boxFilter_kernel.d"
"../src/boxFilter_kernel.cu"
/usr/local/cuda-6.0/bin/nvcc --compile -G -I"/usr/local/cuda-6.0/samples/3_Imaging" -I"/usr/local/cuda-6.0/samples/common/inc"
-I"/home/satish/cuda-workspace_new/boxfilter-arm" -O0 -g -gencode arch=compute_30,code=compute_30 -gencode arch=compute_32,
code=sm_32 --target-cpu-architecture ARM -m32 -ccbin arm-linux-gnueabihf-g++-4.6  -x cu -o  "src/boxFilter_kernel.o"
"../src/boxFilter_kernel.cu"
Finished building: ../src/boxFilter_kernel.cu
After the compilation steps, the linker will resolve all library references, giving you a boxfilter-arm binary that is ready to run.
Running Your First Jetson TK1 Application from Nsight
To run the code on the target Jetson TK1 system, click on Run As->Remote C/C++ Application to setup the target system user and host address.
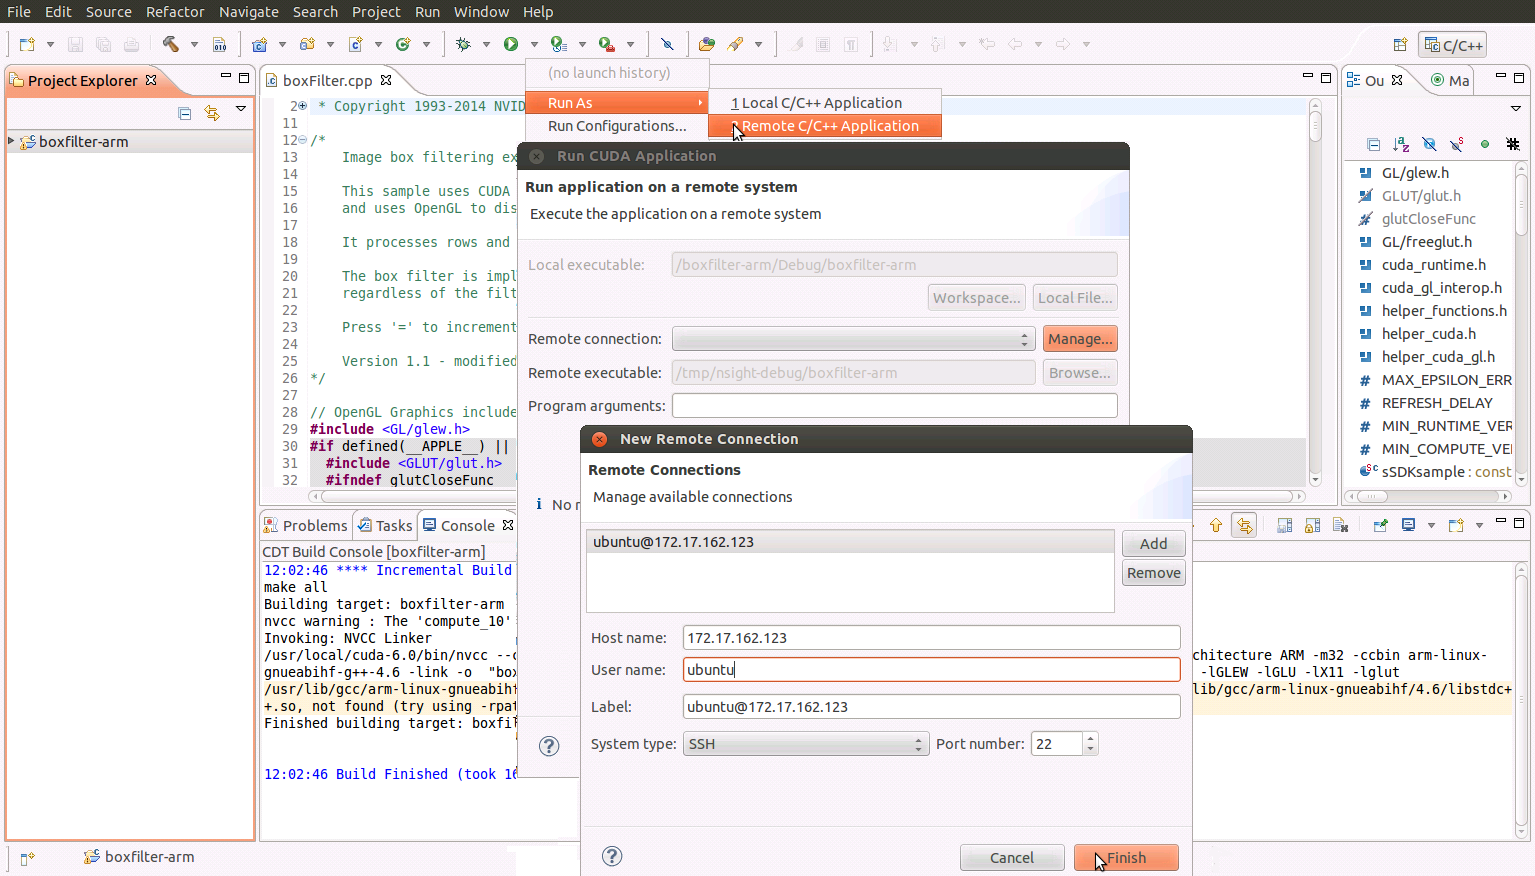
Once you finish the remote target system configuration setup, click on the Run icon and you will see a new entry to run the boxfilter-arm binary on the Jetson TK1.
Note: Box filter application relies on data files that reside in the data/ subfolder of the application, which will need to be copied to the target system. Use the scp utility to copy those files into the /tmp/nsight-debug/data/ folder on your Jetson TK1.
Next, edit the boxfilter.cpp file as follows:
1. To ensure that the application runs on the correct display device, add this line to the top of the main function:
setenv(“DISPLAY”, “:0”, 0);
2. Add the following lines to the top of the display function so that app auto-terminates after a few seconds. This is required to gather deterministic execution data across multiple runs of the application, which we will need later in the profiling section:
static int icnt = 120;
while(!icnt--)
{
    cudaDeviceReset();
    _exit(EXIT_SUCCESS);
}
Click on Run to execute the modified Box Filter application on your Jetson TK1.
Debugging Your First Jetson TK1 Application in Nsight
The remote target system configuration that you set up in Nsight earlier will also be visible under the debugger icon in the toolbar.
Before you launch the debugger, note that by default Jetson TK1 does not allow any application to solely occupy the GPU 100% of the time. In order to run the debugger, we need to fix this. On your Jetson TK1, login as root (sudo su) and then disable the timeout as follows (in future releases of CUDA, the debugger will handle this automatically):
root@tegra-ubuntu:/home/ubuntu# echo N > sys/kernel/debug/gk20a.0/timeouts_enabled
Now we can launch the debugger using the debug icon back on the host system. Nsight will switch you to its debugger perspective and break on the first instruction in the CPU code. You can single-step a bit there to see the execution on the CPU and watch the variables and registers as they are updated.
To break on any and all CUDA kernels executing on the GPU, go to the breakpoint tab in the top-right pane of Nsight and click on the cube icon dropdown. Then select the “break on application kernel launches” feature to break on the first instruction of a CUDA kernel launch. You can now resume the application, which will run until the first breakpoint is hit in the CUDA kernel. From here, you can browse the CPU and GPU call stack in the top-left pane. You can also view the variables, registers and HW state in the top-right pane. In addition, you can see that the Jetson TK1’s GPU is executing 16 blocks of 64 threads each running on the single Streaming Multiprocessor (SMX) of this GK20A GPU.
You can also switch to disassembly view and watch the register values being updated by clicking on the i-> icon to do GPU instruction-level single-stepping.
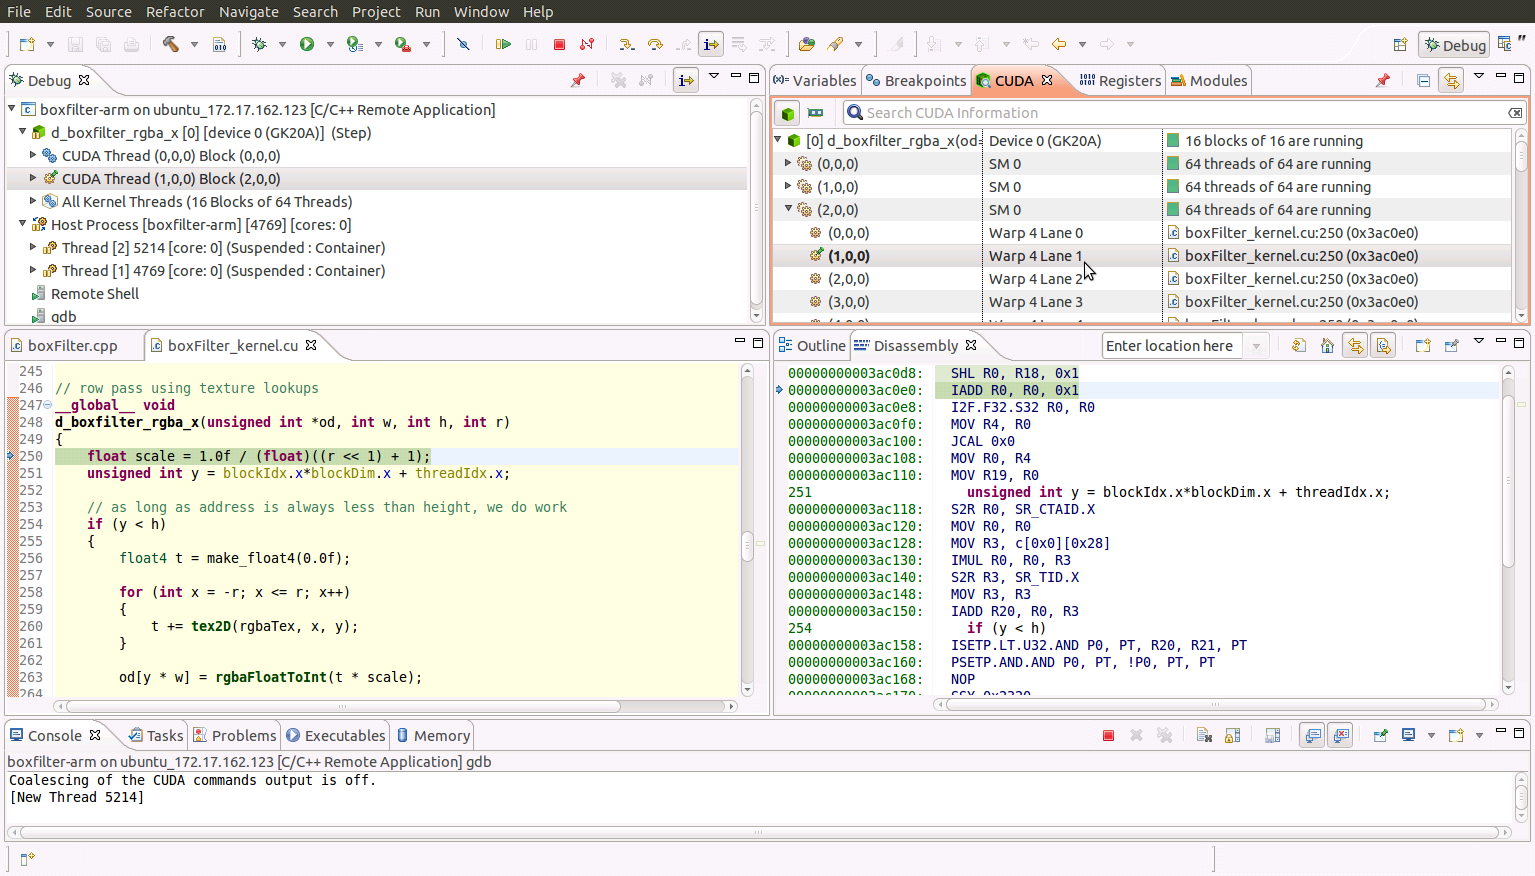
To “pin” (focus on) specific GPU threads, double click the thread(s) of interest in the CUDA tab in the top-right pane. The pinned CUDA threads will appear in the top-left pane, allowing you to select and single-step just those threads. (Keep in mind, however, that single-stepping a given thread causes the remaining threads of the same warp to step as well, since they share a program counter.) You can experiment and watch this by pinning threads that belong to different warps.
There are more useful debug features that you will find by going into the debug configuration settings from the debug icon drop down, such as enabling cuda-memcheck and attaching to a running process (on the host system only).
To quit the application you are debugging, click the red stop button in the debugger perspective.
Profiling Your First Jetson TK1 Application in Nsight
Let’s switch back to the C++ project editor view to start the profiler run. The remote target system configuration you setup in Nsight earlier will also be visible to you under the profiler icon in the toolbar.
Before you launch the profiler, note that you need to create a release build with -lineinfo included in the compile options. This tells the compiler to generate information on source-to-instruction correlation. To do this, first go to the project settings by right-clicking on the project in the left pane. Then navigate to Properties->Build->Settings->Tool Settings->Debugging and check the box that says “Generate line-number…” and click Apply.
Back in the main window, click on the build hammer dropdown menu to create a release build. Resolve any build issues as you did during the first run above, then click on the Run As->Remote C/C++ Application to run the release build of the application. At this point Nsight will overwrite the Jetson TK1 system with the release binary you want to profile and run it once.
Next click on the profile icon dropdown and choose Profile Configurations where you must select “Profile Remote Application” since the binary is already on the Jetson TK1. Nsight will then switch you to the profiler perspective while it runs the application to gather an execution timeline view of all the CUDA Runtime and Driver API calls and of the kernels that executed on the GPU. The properties tab displays details of any event you select from this timeline; the details of the events can also be viewed in text form in the Details tab in the lower pane.
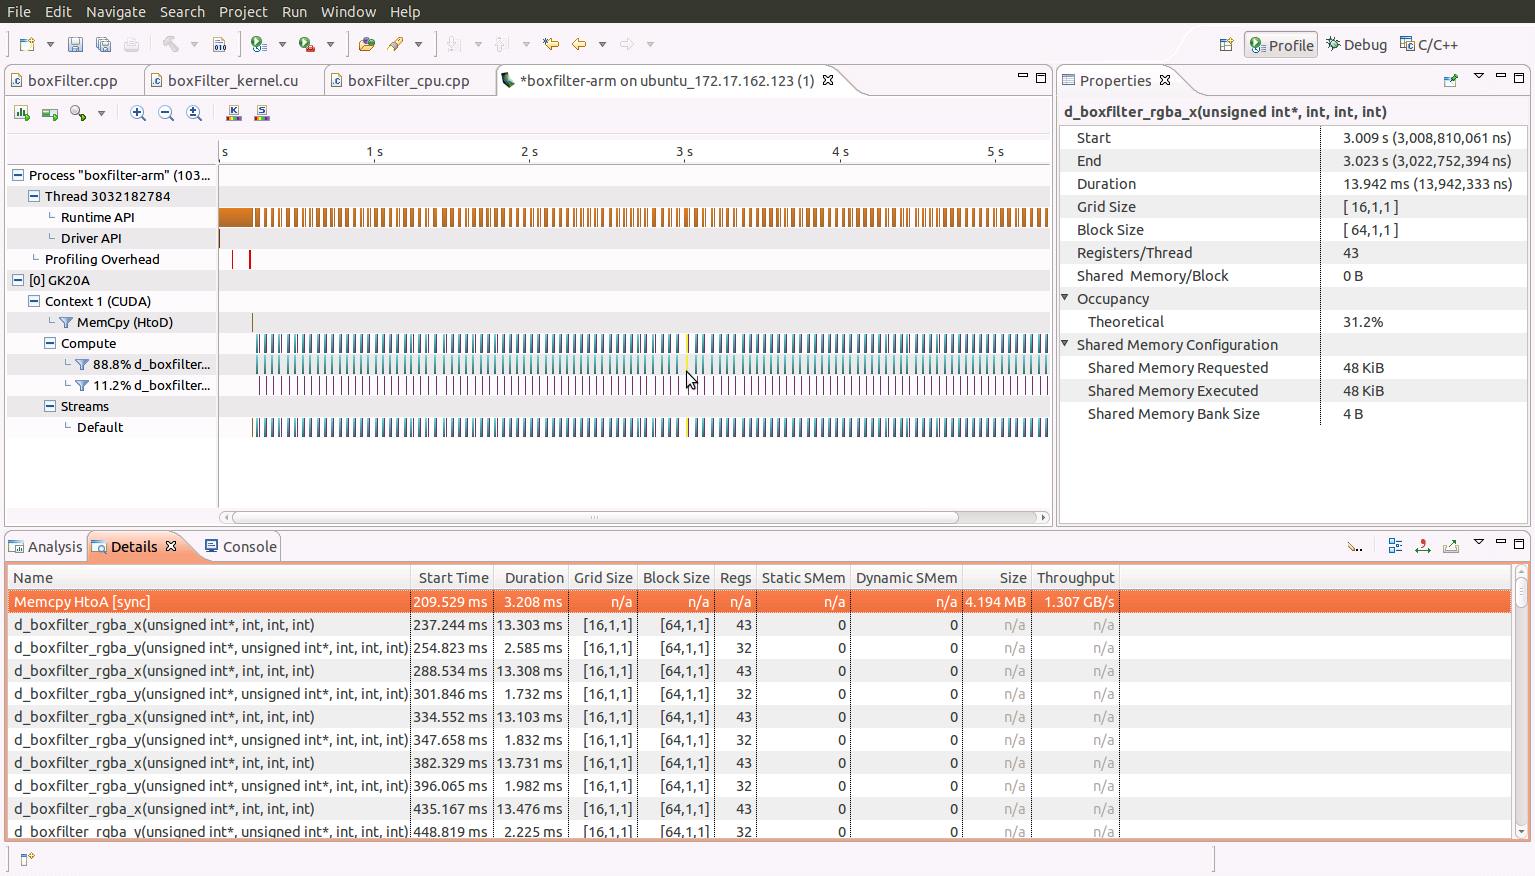
Below the timeline view in the lower pane, there is also an Analysis tab that is very useful for performance tuning. It guides you through a step-by-step approach on resolving performance bottlenecks in your application. You can switch between guided and unguided analysis by clicking on their icons under the Analysis tab.
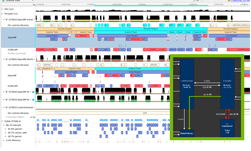
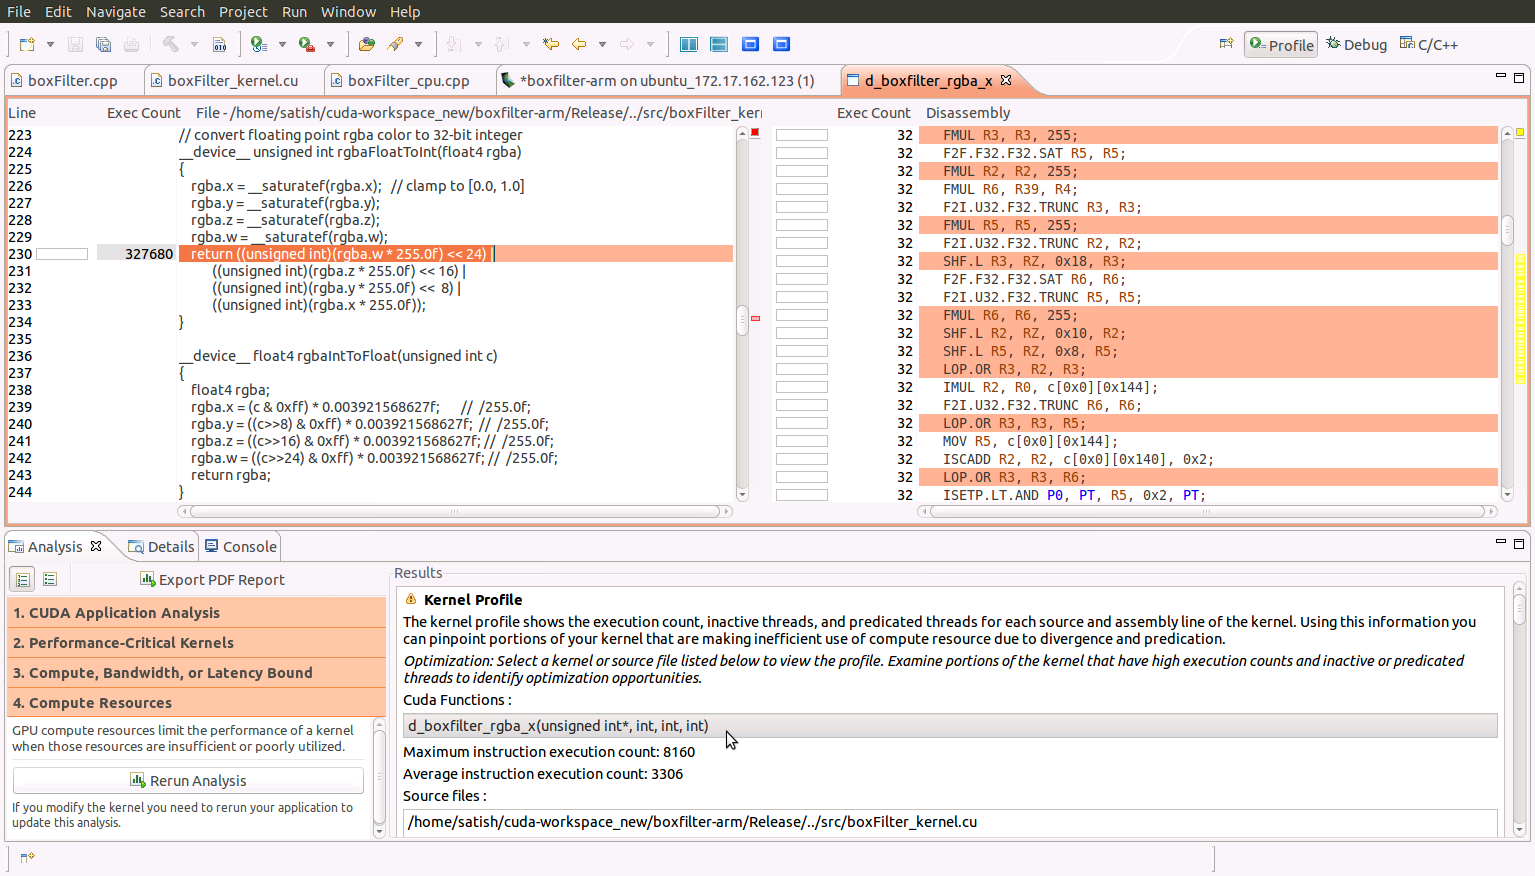
You can also get a source-to-instruction correlation view, with hot spots (where the instructions-executed count was particularly high) identified in red as shown in the figure below. You get this view from within the guided analysis mode by first clicking on “Examine Individual Kernels” and selecting the highest ranked (100) kernel from the list of examined kernels, then clicking “Perform Kernel Analysis” followed by “Perform Compute Analysis.” From there, clicking “Show Kernel Profile” will show d_boxfilter_rgba_a kernel in the right pane. Double-click on the kernel name to see the source-to-instruction view. Clicking on a given line of source code highlights the corresponding GPU instructions.
As you can see, whether you are new to NVIDIA® Nsight™ Eclipse Edition or an avid Nsight user, Nsight makes it just as easy and straightforward to create CUDA applications for the Jetson TK1 platform as for all your CUDA-enabled GPUs.