If you use the NVIDIA Visual Profiler or the nvprof command line tool, it’s time to transition to something newer: NVIDIA Nsight Tools.
Don’t worry! The new tools still offer the same profiling / optimization / deployment workflow. The type of data you need to look at is the same. The commands have changes and the output looks a little different, but we’re here to guide you through the transition. This is the first in a series of posts designed to help ease the transition from NVIDIA Visual Profiler (NVVP) or nvprof, to the NVIDIA Nsight tools. The new tools are powerful, fast, and feature rich, allowing you to find solutions even more quickly. Table 1 maps the key features of NVIDIA Visual Profiler and nvprof to the NVIDIA Nsight tools.
|
Feature categories |
NVIDIA Visual Profiler/nvprof |
Nsight Compute |
Nsight Systems |
|
Timeline/Activity/API Tracing |
✓ |
|
✓ |
|
NVTX |
✓ |
✓ |
✓ |
|
OpenACC |
✓ |
|
✓ |
|
OpenMP |
✓ |
|
Future |
|
MPI |
✓ |
|
Future |
|
MPS |
✓ |
|
✓ |
|
CPU Sampling |
✓ |
|
✓ |
|
metrics (per kernel) |
✓ |
✓ |
|
|
metrics (periodic sampling) |
✓ |
Future |
Future |
|
Guided Analysis |
✓ |
✓ |
|
|
GPU kernel PC Sampling |
✓ |
✓ |
|
|
Remote Profiling |
✓ |
✓ |
✓ |
Making the Best Better
NVIDIA Visual Profiler has been shipping to customers since 2008, enabling developers to solve problems in multiple application domains. Unfortunately, improving and supporting the evolving and increasingly complex software of modern GPU-accelerated applications meant rearchitecting them from scratch. Three major reasons exist for this.
Data Size
NVIDIA Visual Profiler analysis slows downs with data files above 100MB of data and GUI refresh starts to become a problem with large runs of more than 2-4 GPUs. The data processing/visualization technology inside NVIDIA Visual Profiler will not scale to long captures, large servers, or massively parallel/cluster systems. This is an important long-term goal for NVIDIA’s profiling tools. NVIDIA Nsight Systems users have performed analysis on results with over 50 million events and over 2 GB of data without any noticeable slowdown when visualizing.
Collector Tradeoffs
NVIDIA Visual Profiler both traces (CUDA API and GPU activities) and profiles (CUDA kernels). In order to expand the trace activity to encompass broader system-wide performance data, splitting out the trace activity into its own product was necessary as it increasingly diverged from CUDA kernel profiling. For example, system tracing is sensitive to perturbation of the system with excess overhead whereas kernel profiling requires rerunning and other high-overhead data gathering techniques that require more complex logic in the same places. Nsight Systems can now focus on minimizing overhead for system analysis while Nsight Compute focuses on precise replay mechanisms.
Future Enhancements
NVIDIA Visual Profiler’s collection system is very CUDA centric and not easily extensible. This made it impractical to add the additional features required to give a more complete picture of GPU activity. The NVIDIA Nsight tools include several additional features, with more to come:
- NVIDIA Nsight Systems adds multi-process multi-core CPU backtraces, OS runtime events trace, blocked state backtraces, DirectX, OpenGL and Vulkan trace, and stutter analysis.
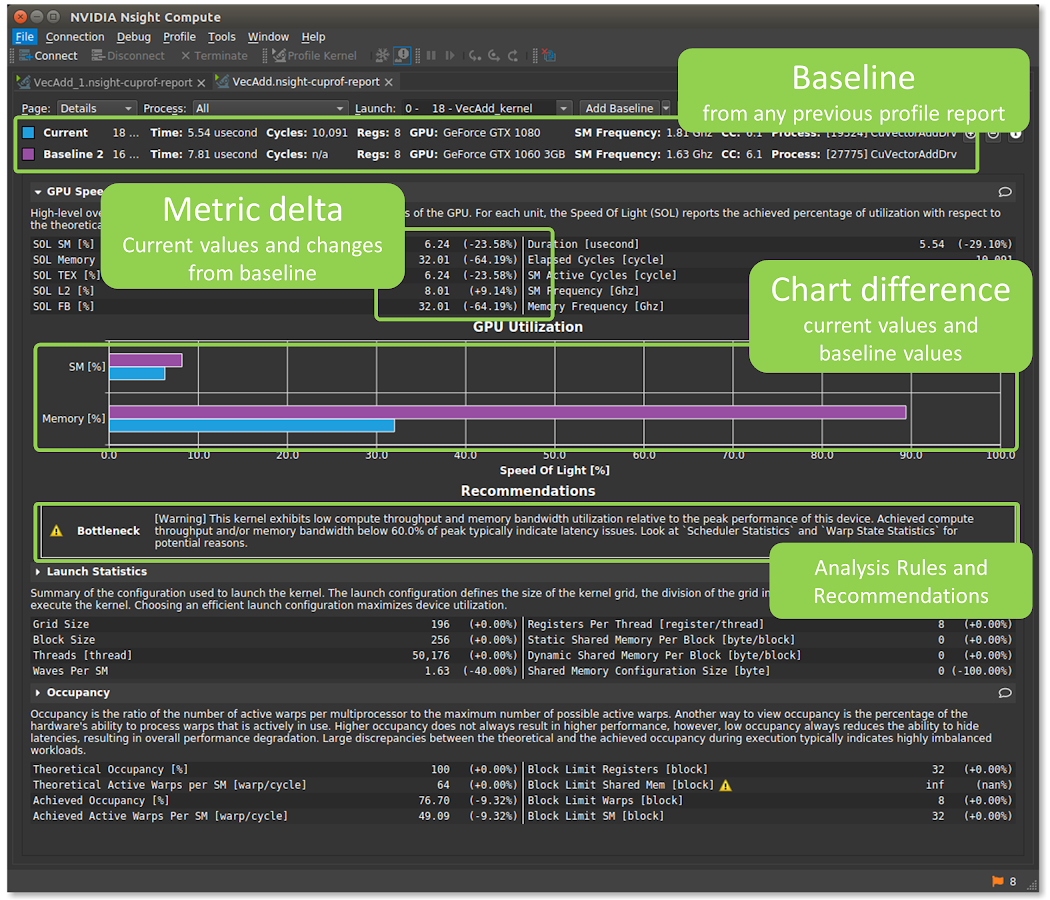
- NVIDIA Nsight Compute adds interactive API debugging and kernel profiling for CUDA applications. Users can set multiple “baselines” in the kernel profiler report to compare results of different kernel executions. The reports and rules are fully customizable and can be extended with analysis scripts for post-processing results.
Figure 1 highlights the data flows between the new tools.

Nsight Systems for Tracing CUDA APIs and CPU Sampling
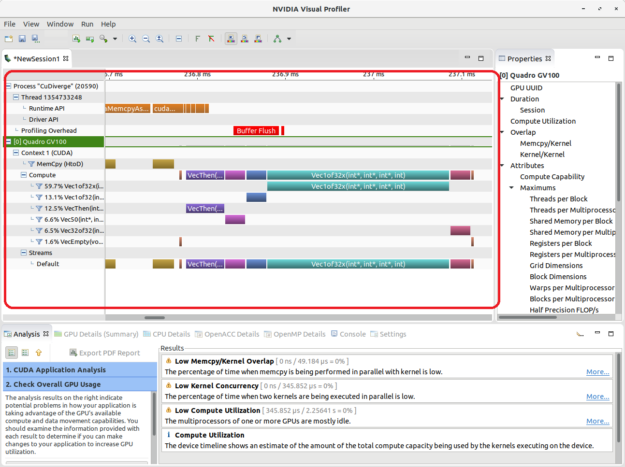
When you trace in NVIDIA Visual Profiler, you are used to seeing the data presented as shown in figure 2. NVIDIA Nsight Systems gives you the same data and controls when you trace APIs.
NVIDIA Nsight Systems is a low-overhead system profiling tool,as shown in figure 3. Use it to make sure you know where your bottlenecks truly are. Before you deep dive into your CUDA kernel code, you should rule out other more fundamental performance limiters like unnecessary GPU-CPU synchronization, CPU bound situations, or just using a poor CPU-side job scheduling algorithm – and this is what Nsight Systems can help you with. Use it as your initial profiler, after making major refactors, or hardware changes in the system. You won’t get full benefit out of a new faster GPU if the CPU isn’t feeding it well enough to keep it busy.

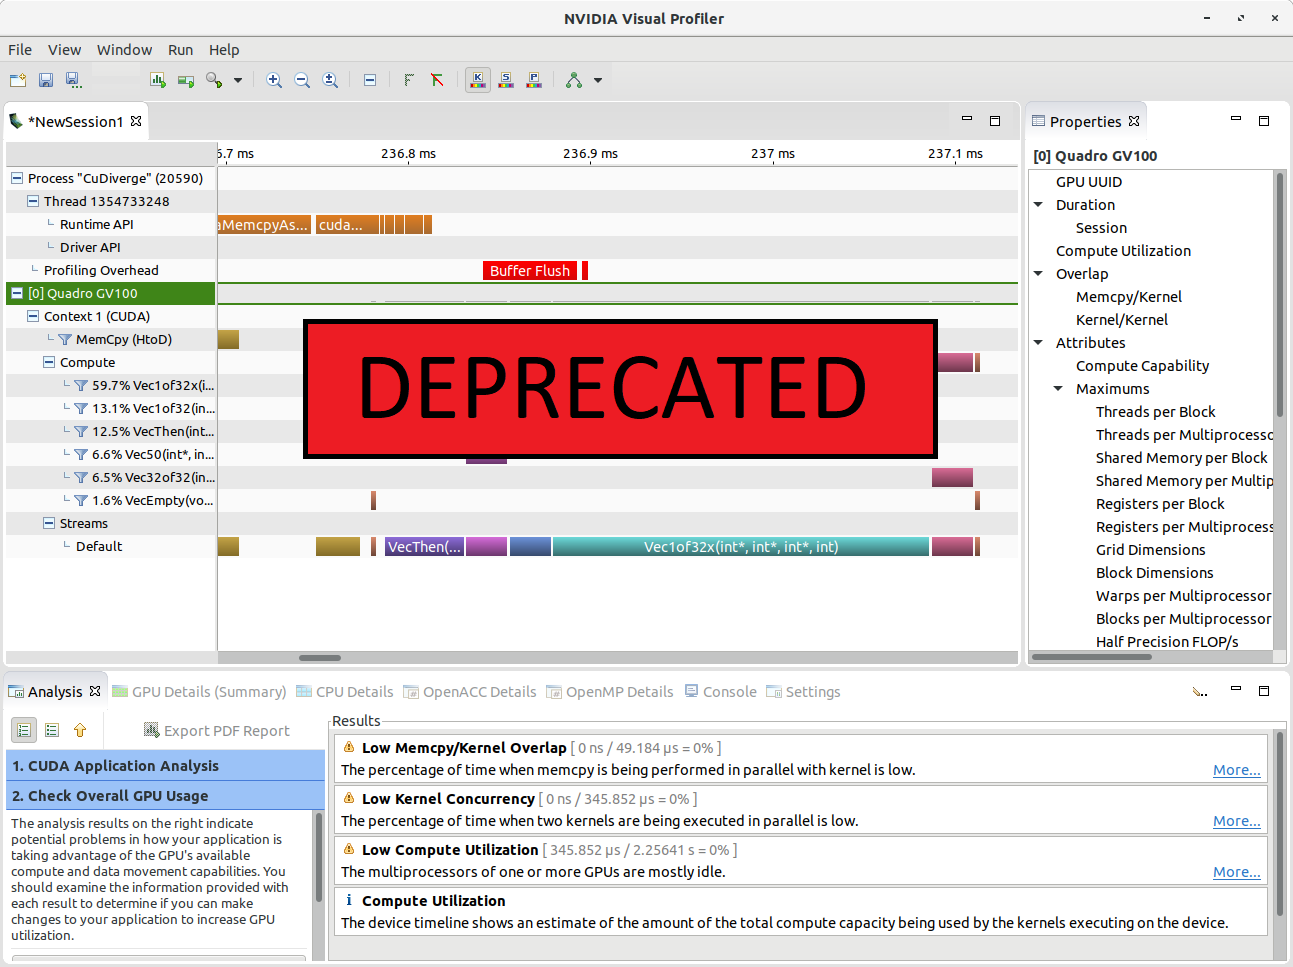
Use NVIDIA Visual Profiler for Metrics and Events? Switch to using NVIDIA Nsight Compute.
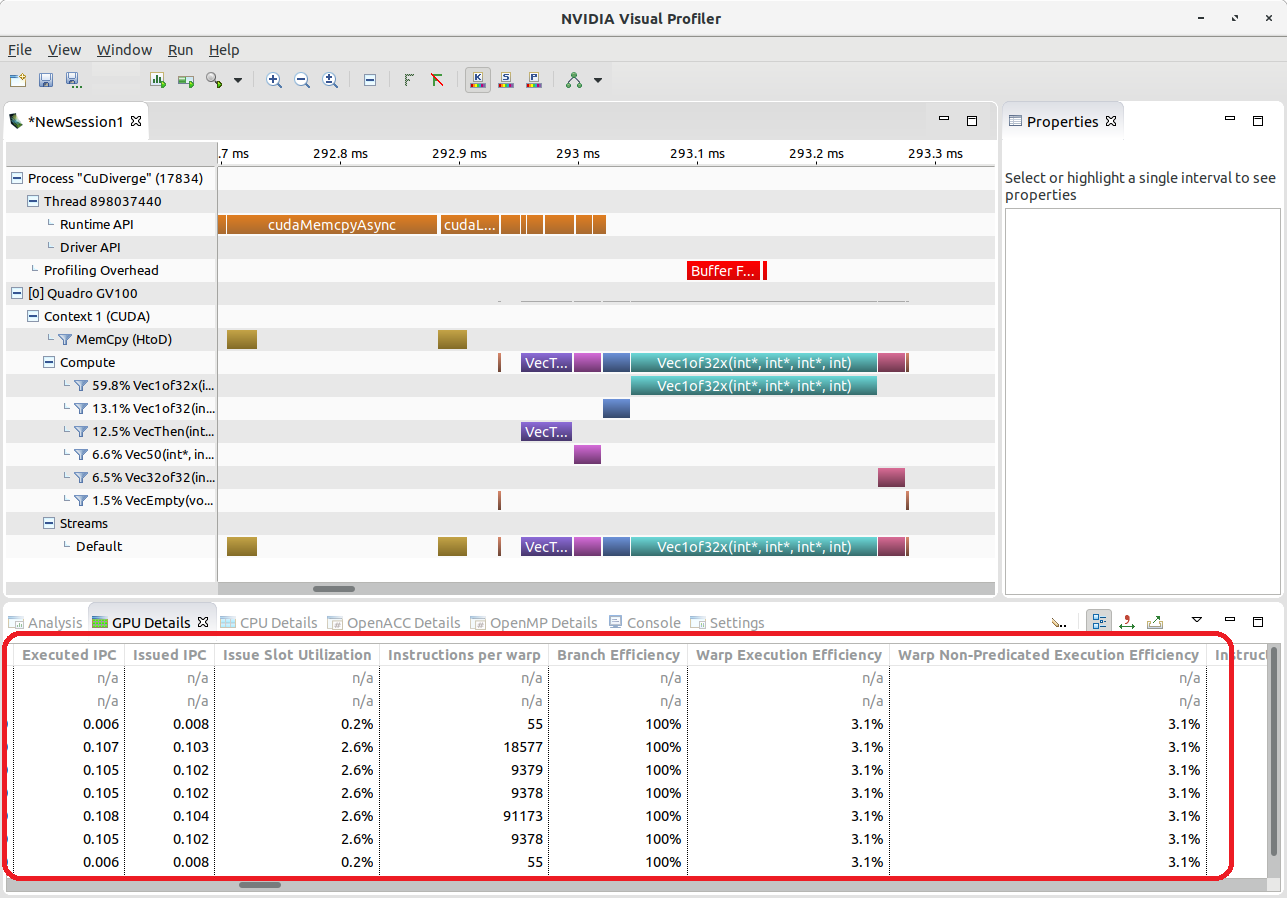
Figure 4 shows how the data is typically presented when you look at metrics in NVIDIA Visual Profiler.
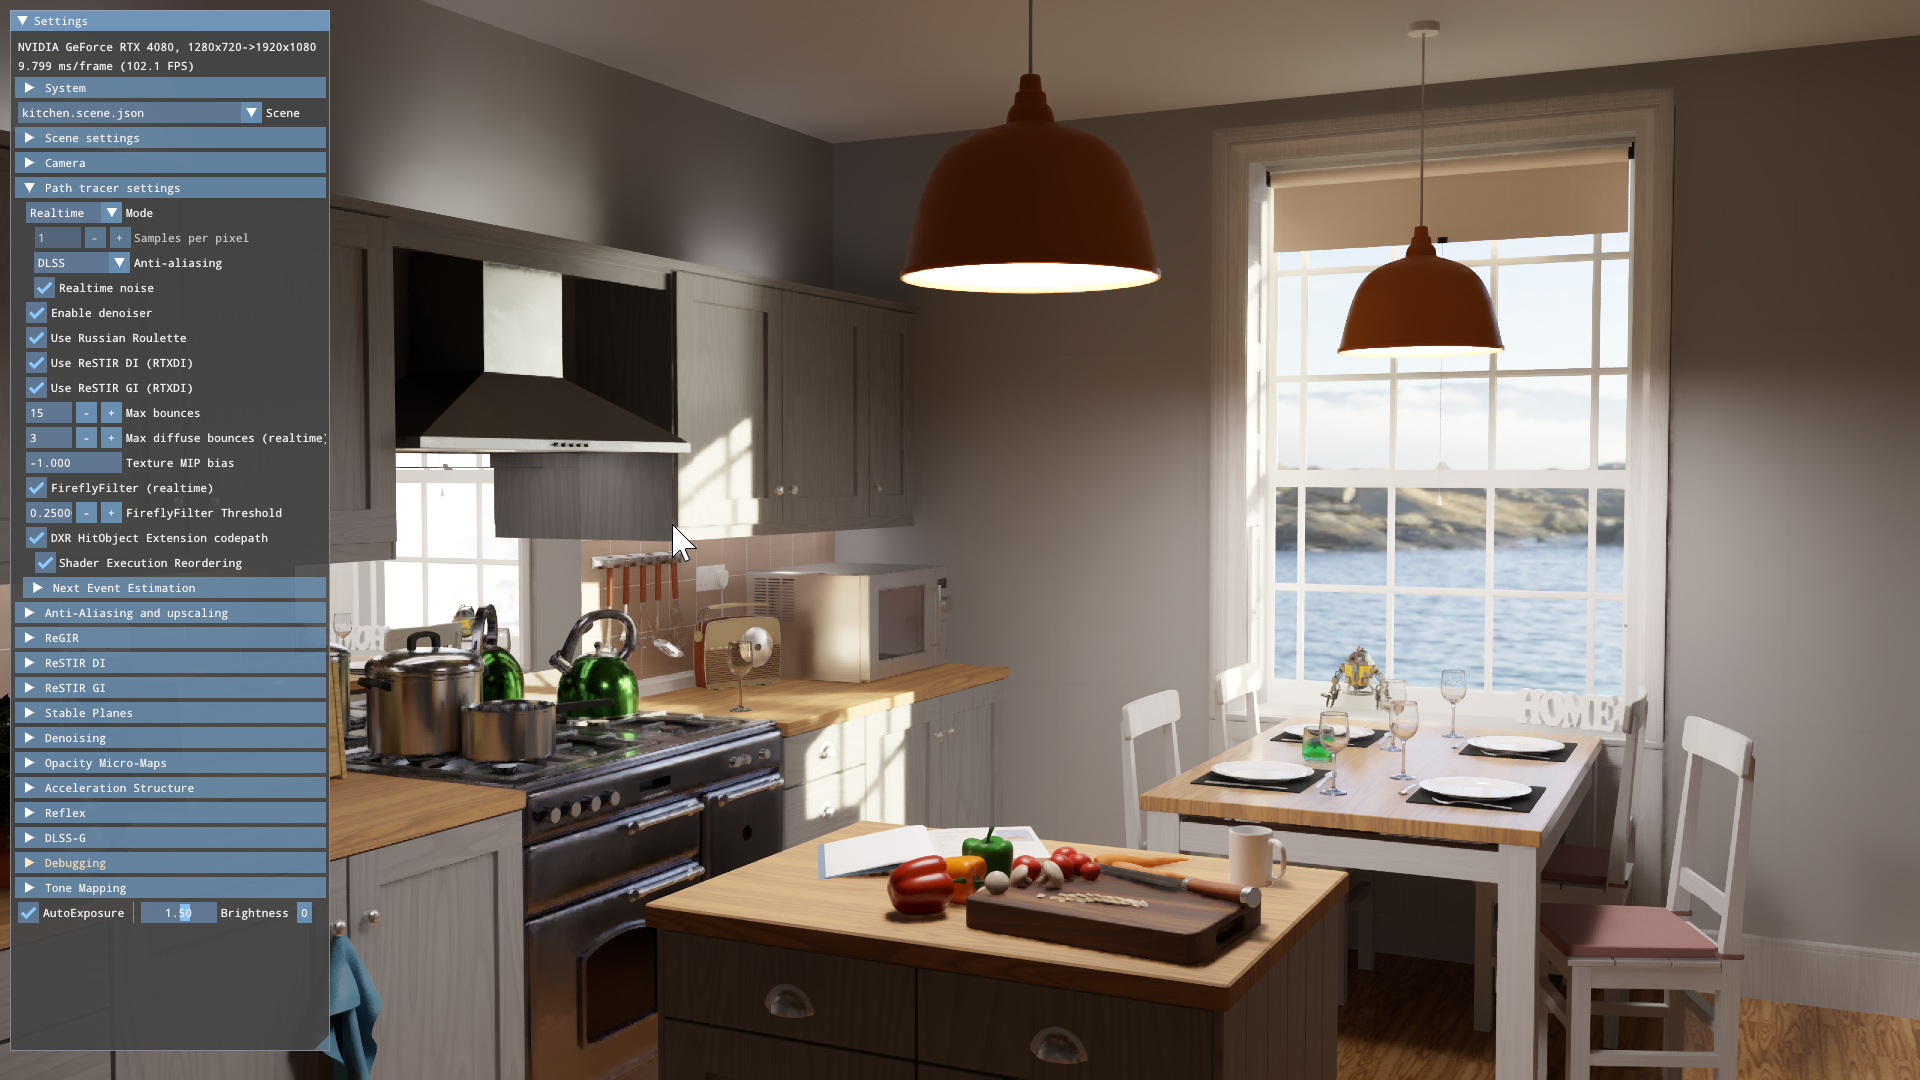
NVIDIA Nsight Compute, shown in figure 5, is a low level CUDA kernel profiling tool. Use it when NVIDIA Nsight Systems shows underperforming kernels, ones that have gotten noticeably worse in code refactors, or have become performance bottlenecks. Furthermore, use it during kernel development to get immediate feedback on how code changes affect your kernel performance and how it compares to previous iterations.
Read more about the transition to NVIDIA Nsight Compute in it’s NVVP Guide.
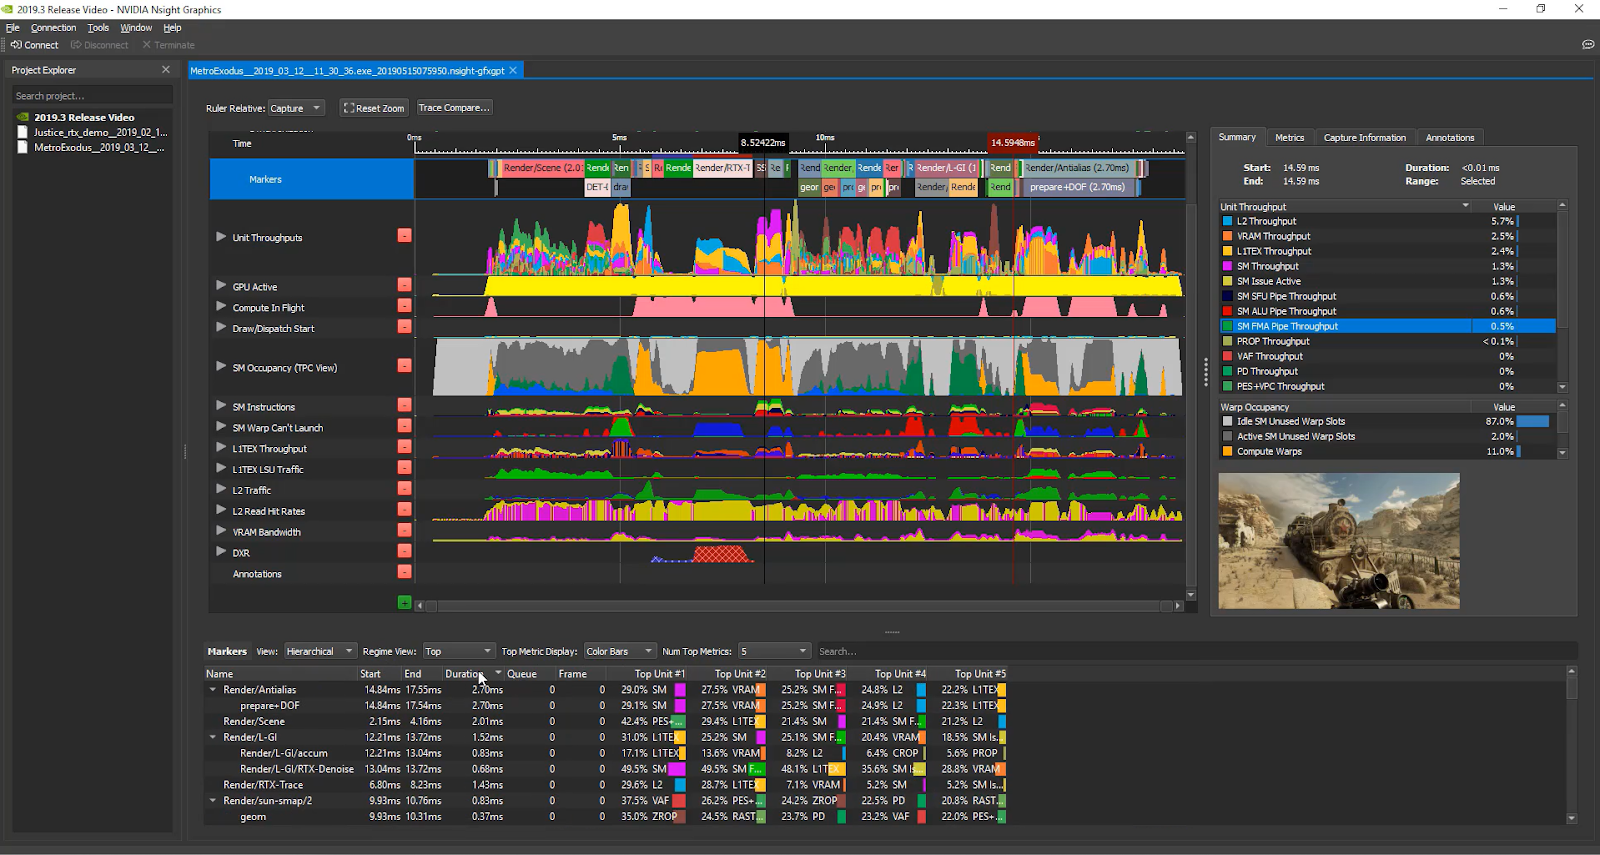
NVIDIA Nsight Graphics
NVIDIA Nsight Graphics is a standalone developer tool that enables you to debug, profile, and export frames built with Direct3D (11, 12, DXR), Vulkan (1.1, NV Vulkan Ray Tracing Extension), OpenGL, OpenVR, and the Oculus SDK. Use this when NVIDIA Nsight Systems shows that you have a frame or renderer that is GPU bound, as figure 6 shows.
Not sure where to start?
NVIDIA Nsight Systems is the right place to start to minimize doubt or misconceptions about your application execution. It offers a data driven approach to see how your application really uses system resources and where to focus your profiling efforts.
For nvprof Users
As an nvprof user, you’ll be happy to know that the new tools have CLI versions as well. Table 2 lists some of the most commonly used nvprof options and which tool incorporates them. Note that the actual command may well have changed even though careful attention was paid to match one another whenever possible.
|
CUDA profiling options |
Nsight Systems (nsys) |
Nsight Compute (nv-nsight-cu-cli) |
|
aggregate-mode |
|
✓ |
|
analysis-metrics |
|
✓ |
|
annotate-mpi |
Future |
|
|
concurrent-kernels |
Always concurrent |
Future |
|
devices |
|
✓ |
|
kernels |
|
✓ |
|
metrics (m) |
|
✓ |
|
profile-api-trace |
✓ |
|
|
profile-child-processes |
✓ |
✓ |
|
profile-from-start |
✓ |
✓ |
|
query-metrics |
|
✓ |
|
replay-mode |
|
Future |
|
source-level-analysis (a) |
|
✓ |
|
unified-memory-profiling |
UVM transfers only |
|
|
CPU profiling options |
Nsight Systems (nsys) |
Nsight Compute (nv-nsight-cu-cli) |
|
cpu-profiling |
✓ |
|
|
openacc-profiling |
✓ |
|
|
openmp-profiling |
Future |
|
|
Print and I/O options |
Nsight Systems (nsys) |
Nsight Compute (nv-nsight-cu-cli) |
|
trace |
✓ |
|
|
print-api-summary |
✓ |
|
|
print-api-trace |
✓ |
|
|
print-gpu-summary |
✓ |
✓ |
|
print-summary (s) |
✓ |
✓ |
|
export-profile (o) |
✓ |
✓ |
|
force-overwrite (f) |
✓ |
✓ |
More importantly, if you use the CLI in the new tools you’ll find extra features
Nsight Systems (nsys). Any functionality you can use through the GUI is also available through the CLI. That includes the new support for multi-process CPU backtraces, OS runtime events trace, blocked state backtraces and many 3D graphics APIs on Windows and Linux.
Nsight Compute (nv-nsight-cu-cli). Support for attaching to profile targets on remote systems, GPU clock control for deterministic results and re-usable sections to drive metrics collection and presentation. In addition, the command line also supports the customizable, python-based rule system for guidance on performance data or regression testing.
Interested in Nsight Compute kernel profiling specifically? See nvprof->Nsight Compute transition documentation.
When?
Full featured versions of the new tools have been shipping for over a year. Get NVIDIA Nsight Systems and NVIDIA Nsight Compute from the NVIDIA CUDA ToolKit public download. You can also obtain the most recent, updated Nsight tools with enhancements and fixes beyond the version shipping in the NVIDIA CUDA Toolkit at the Nsight Systems page, Nsight Compute page, or the Nsight Graphics page.
We announced that NVIDIA Visual Profiler and nvprof would be deprecated in a future version after CUDA Toolkit 10.1. More specifically:
- NVIDIA Visual Profiler and nvprof will end support at the Volta GPU architecture
- Nsight Systems begins support with the Pascal GPU architecture
- Nsight Compute begins support with the Volta GPU architecture
- You can find more support details at the Nsight systems and Nsight Compute product pages
Support for IBM Power architecture is not yet available in the Nsight tools but expected in future releases. NVIDIA Nsight Compute support will be available in the upcoming release of the NVIDIA CUDA ToolKit. NVIDIA Nsight Systems will support IBM Power architecture in the future, before NVIDIA Visual Profiler reaches end of life.
Start your transition today!
A Call to Action
This is the first in a series of articles that describe the new tools in depth, show the functionality, and explain how to move your development to the new tools. Check the NVIDIA Developer Blog for future posts covering these topics in greater depth.
If you want to see the tools in action, check out the following links featuring videos from recent GPU Technology Conferences:
- NVIDIA Nsight Systems
- Blue Waters Webinar Series – Nov. 2018 – Introduction to NVIDIA Nsight Systems
- Optimizing HPC Simulation and Visualization Codes Using the NVIDIA Nsight Systems
- Using Nsight Tools to Optimize the NAMD Molecular Dynamic Simulation Program
- Optimizing Facebook AI Workloads for NVIDIA GPUs
- Boost DNN Training Performance using NVIDIA Tools
- NVIDIA Nsight Compute
- NVIDIA Nsight Graphics
We’ve also covered the Nsight tools in previous posts, including Nsight Systems Exposes New GPU Optimization Opportunities and What is Limiting Your Rendering Performance.
Have a question? Post it to the NVIDIA forums using either NVIDIA Nsight Systems or NVIDIA Nsight Compute. Drop a message at <nsight-systems-feedback@nvidia.com> or <nsight-compute-feedback@nvidia.com>. Or just push the Feedback button in the application to let us know what you are seeing and what you think.