While working with game developers on pre-release games, NVIDIA has had a steady flow of bugs reported where a game stutters for multiple milliseconds during gameplay. These stutter bugs can ruin the experience of the gamer, possibly making the game unplayable (as with the release of Batman Arkham Knight on PC), so they should be treated with a high priority.
Until 2018, the only tool that NVIDIA DevTech recommended for finding the root-cause of stutters on Windows was GPUView, which ships with the Windows Performance Toolkit.
On the other hand, Nsight Systems can capture and visualize ETW data from DX11, DX12/DXR, VK/VKR, and GL applications, similar to what GPUView can do. It lets you see all the CPU threads that are executing in each frame and what each thread is doing on a regular basis (using stackwalk events), just like GPUView.
On top of that, it lets you easily locate slow frames (by highlighting the frames that have a frame time greater than a given target). You can also locate stutter frames (by highlighting the frames that have a frame time much greater than the surrounding frames). It also captures accumulated CPU times per frame for certain API calls that we know are likely to cause stutters, and it reports these times in the Frame Health row, under the CPU frame duration row.
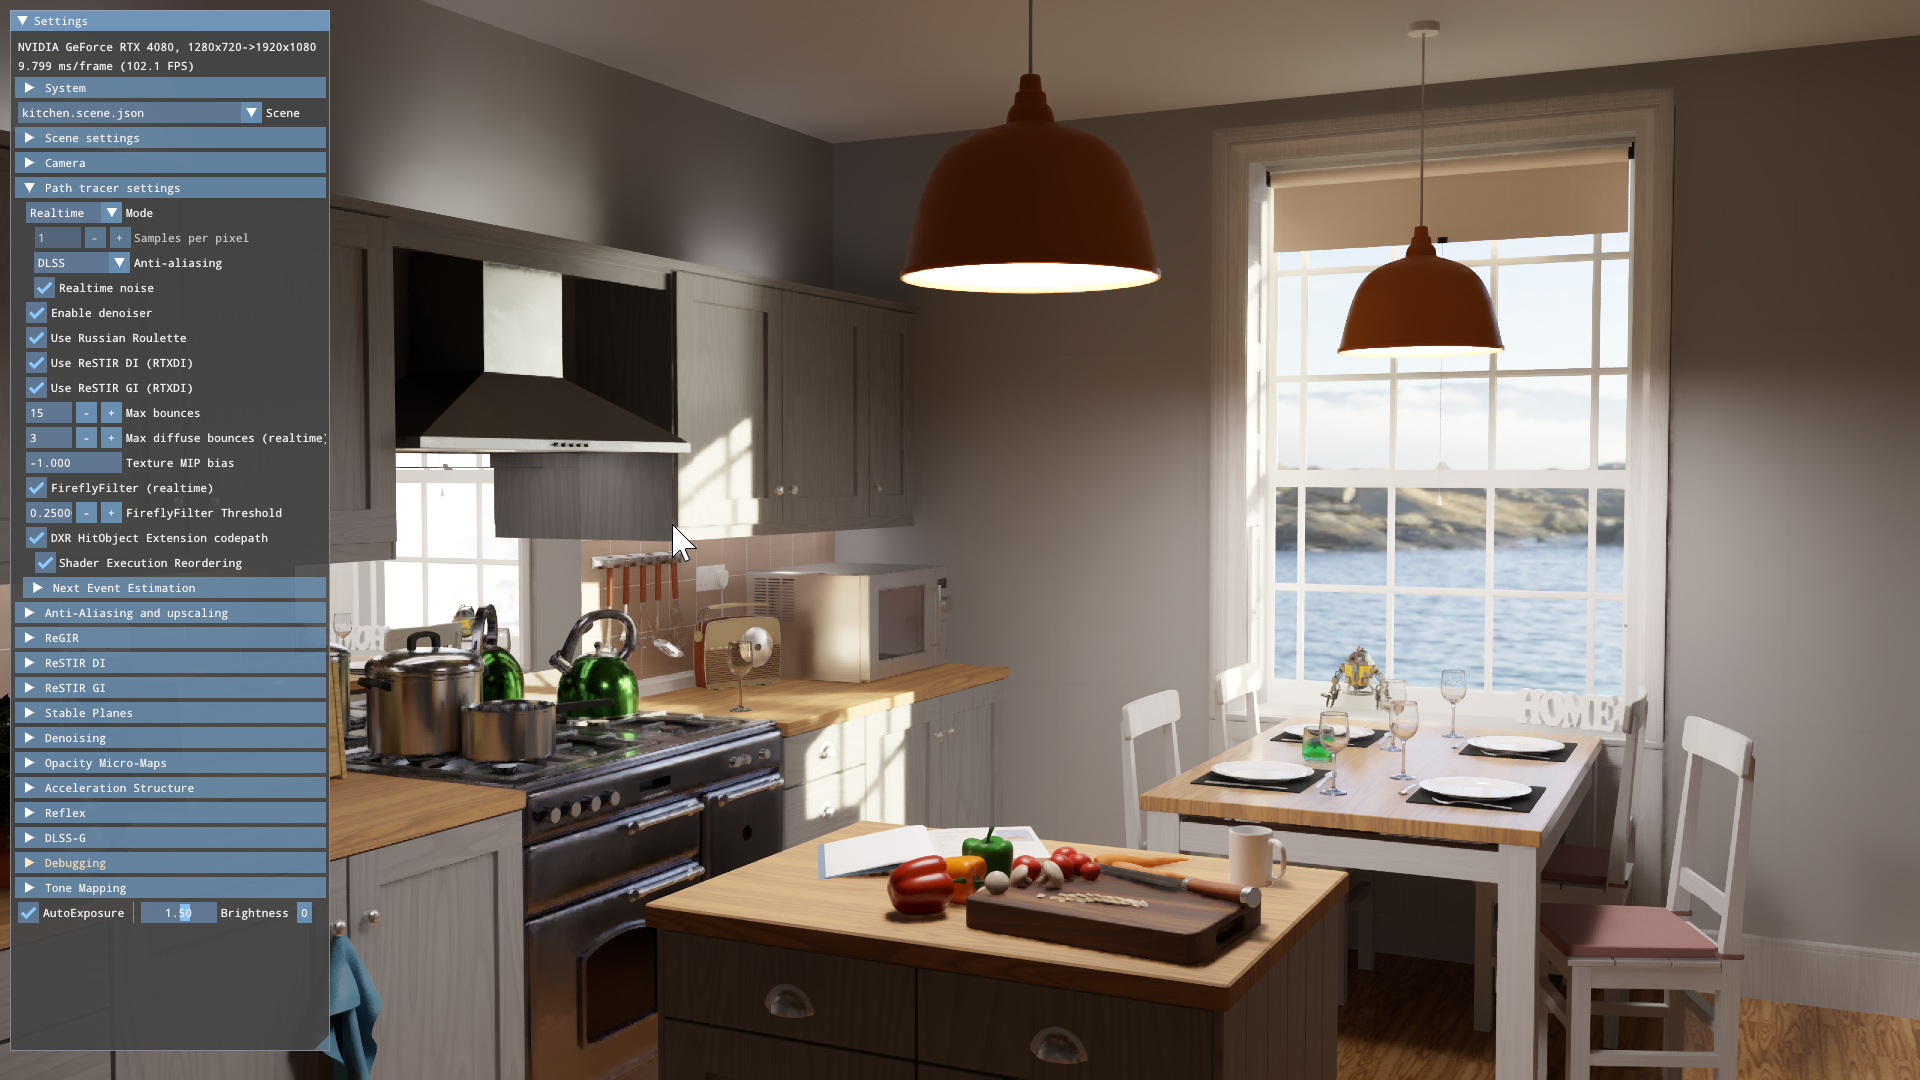
In this post, I show how the tool can be used to find the root cause of a stutter bug that we had to fix during the integration of ray-traced reflections in Wolfenstein: Youngblood (VKR).
Capturing a Nsight Systems trace
When you launch Nsight Systems, the tool creates an empty project and you see the form in Figure 1.
To capture data from your local computer, choose Localhost connection. After you’ve chosen Select, the tool sets itself up (which may take a few seconds) and then displays this form that matches the capabilities of your operating system, as shown in Figure 2.
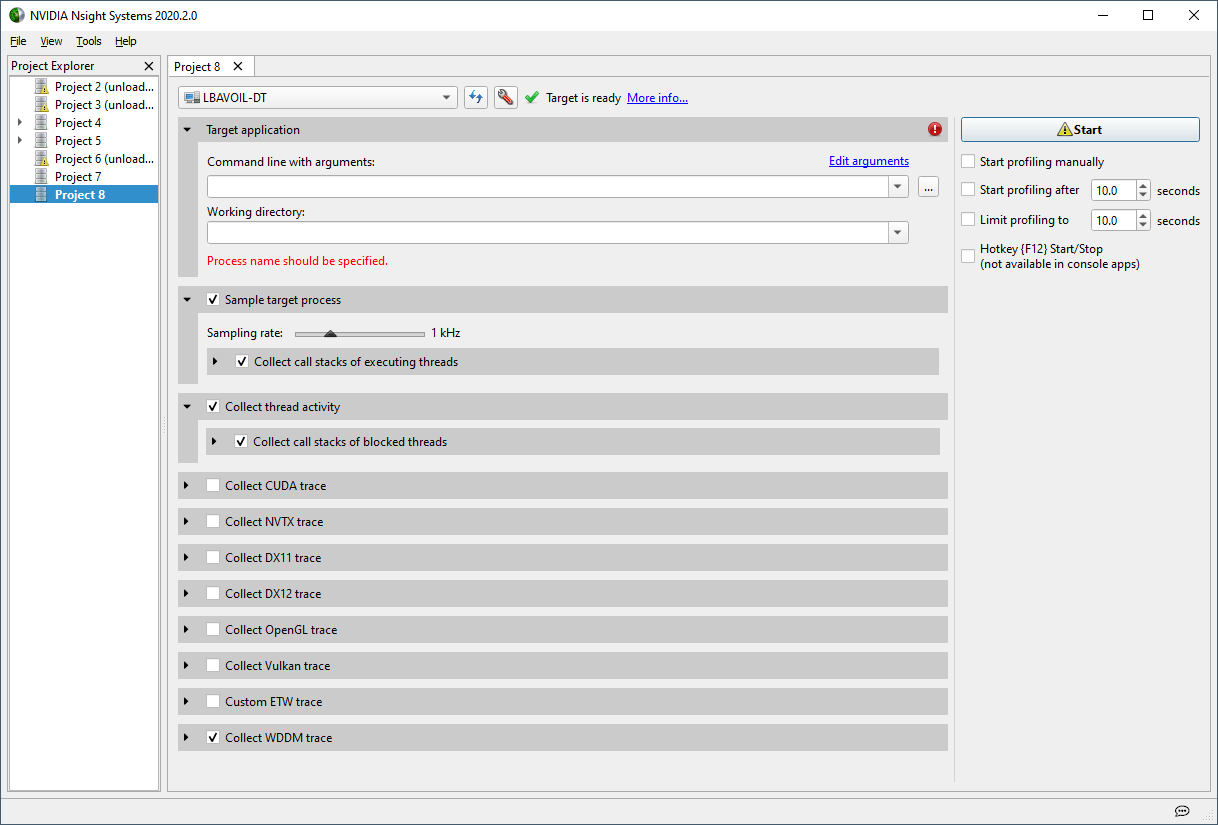
At this point, we recommend the following steps:
- Enter the path to your application EXE file.
- To specify any EXE arguments, choose Edit Arguments.
- Set the working directory.
- Leave the checkboxes that are already set.
- Keep Collect WDDM trace enabled.
- If your app is using Vulkan, enable Collect Vulkan trace.
- If your app is using DX12, enable Collect DX12 trace.
- Enable Start Profiling Manually and Hotkey (F12) Start/Stop.
When you’ve done all this, choose Start and the tool then launches your application. To start capturing a trace, press F12, repro the stutter bug, and then press F12 again to stop capturing the trace. The tool then immediately starts post-processing the data, which may take a while depending on how long your trace was.
To avoid long post-processing and trace-loading times, I recommend that your traces be no more than one minute long.
Currently, a single trace capture can be captured per application run.
Analyzing a trace
After the post-processing of the capture is complete, the trace is saved to disk as a .qdrep file and the tool opens the trace automatically.
Zooming on a stutter frame
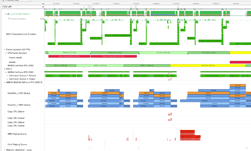
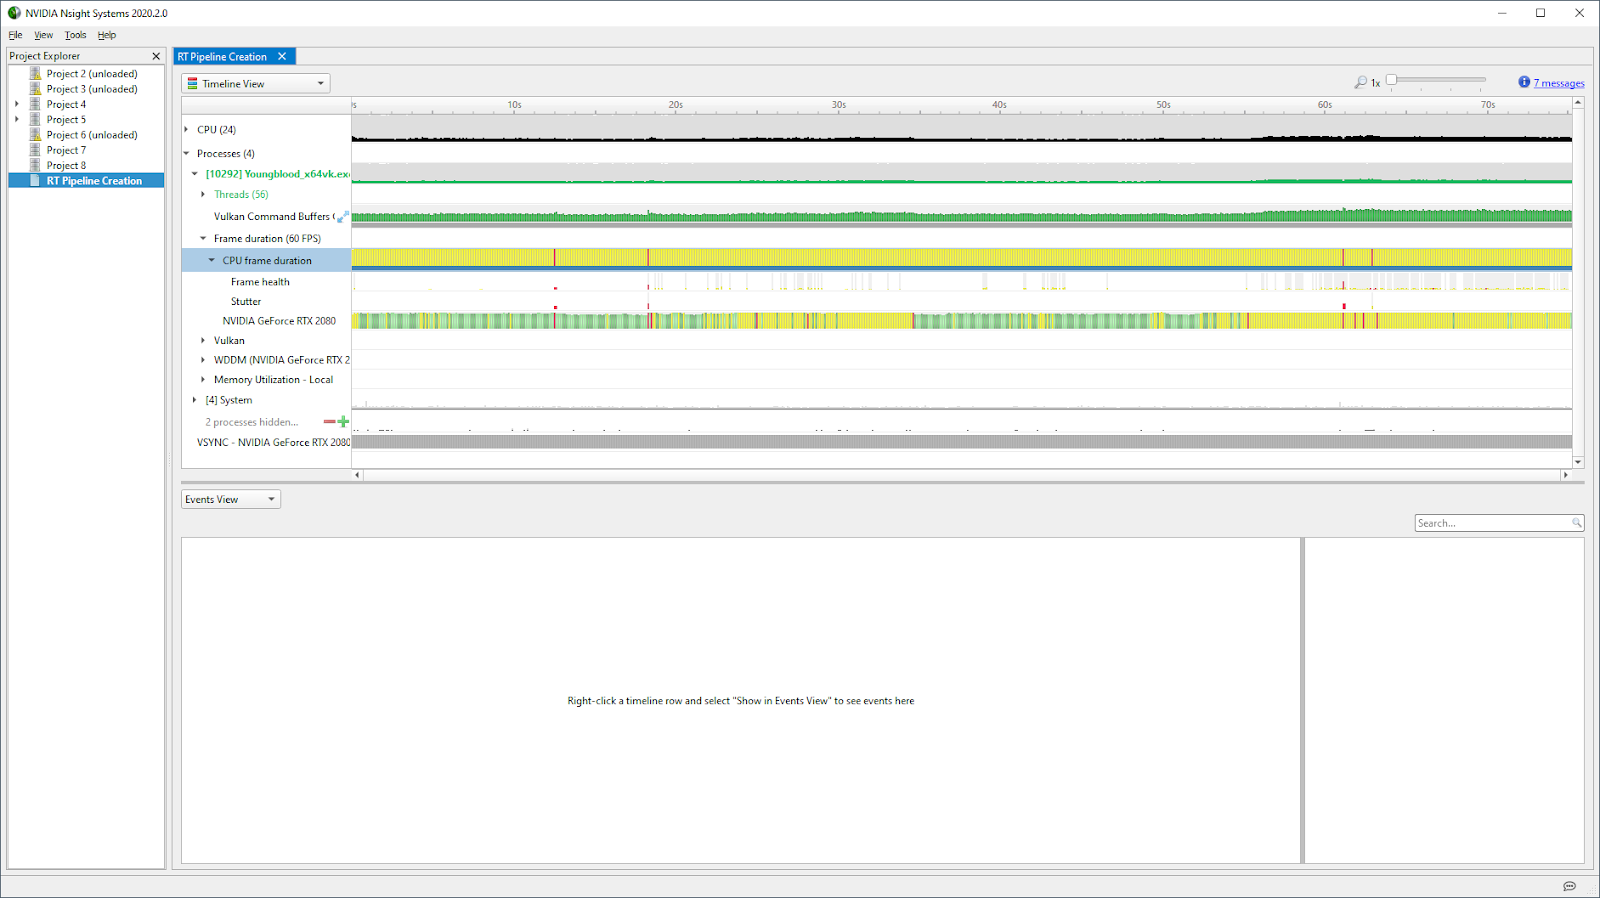
Here’s a trace that was generated from a gameplay session where a >10ms stutter happened in a frame while the user was walking around in a map. When the tool opens the trace, not much is visible, as shown in Figure 3.
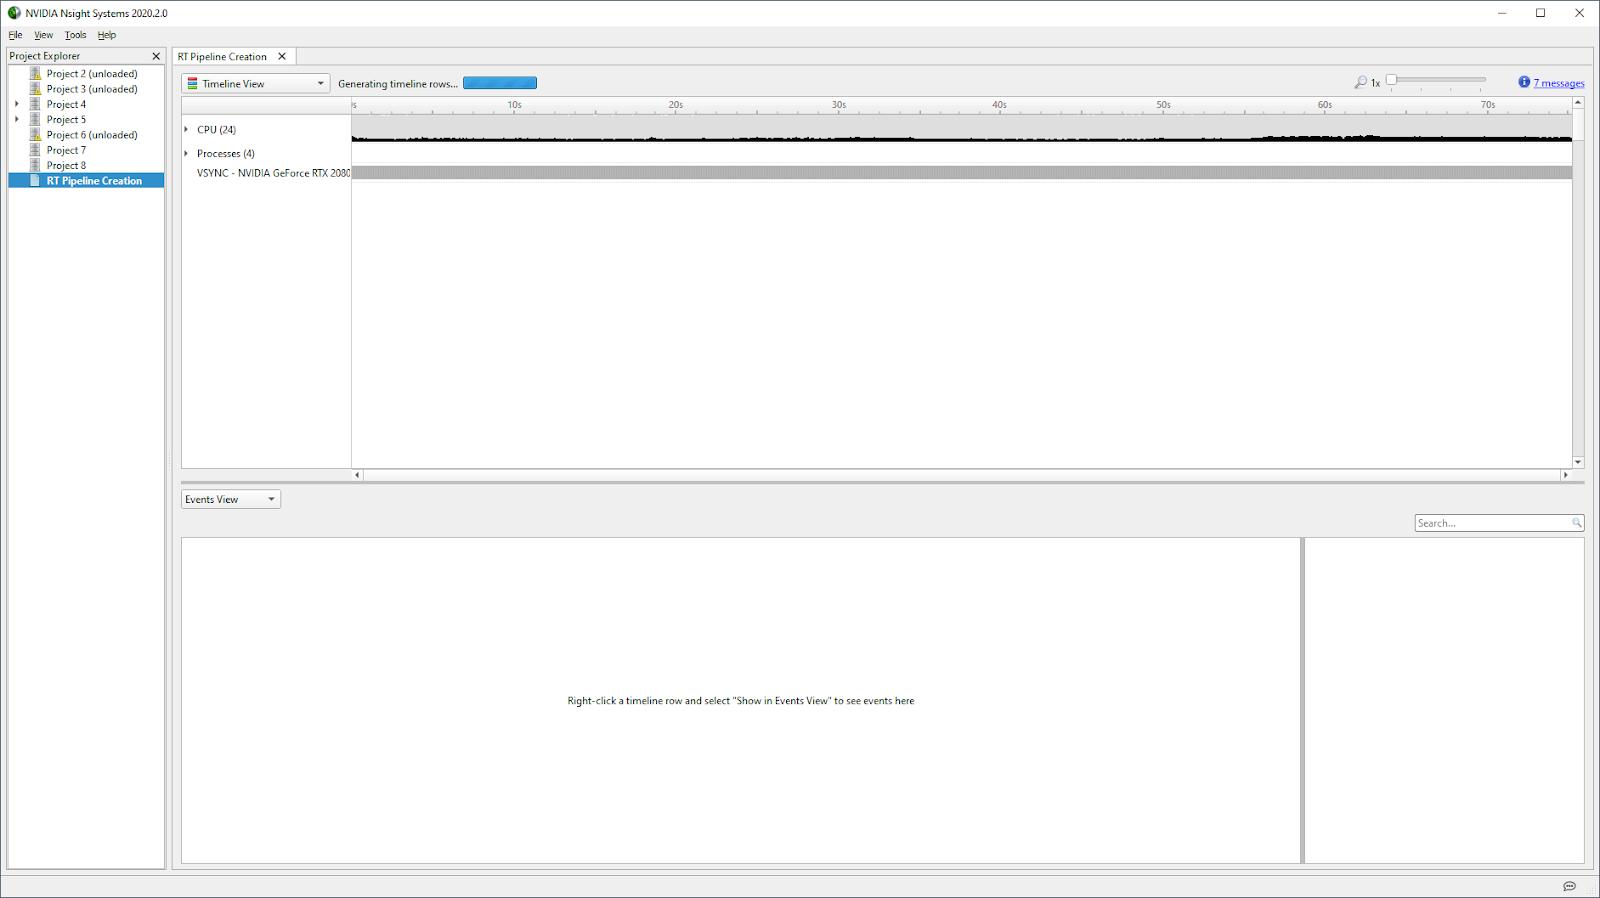
In the left navigation pane, expand Processes, Frame duration, and CPU frame duration for more information, as shown in Figure 4. The CPU frame duration is the frame time measured on the CPU, from end of Present to end of Present. The GPU frame duration (on the row that contains the GPU name) is the frame time measured from the beginning of the first executed GPU command to the end of the last executed GPU command. Frames with time > target are highlighted in red on the Frame Duration row. Stutter frames are indicated in red on the stutter sub-row.
The Frame duration row shows a few frames in red. Let’s zoom on the first one. To do this, we can select a time range in the timeline that contains the first red frame, and then drag and drop the left mouse cursor to get this context menu.
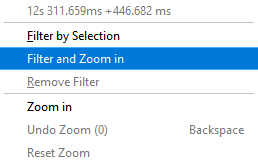
By choosing Filter and Zoom in, the tool zooms in on the selected time range, as shown in Figure 6.
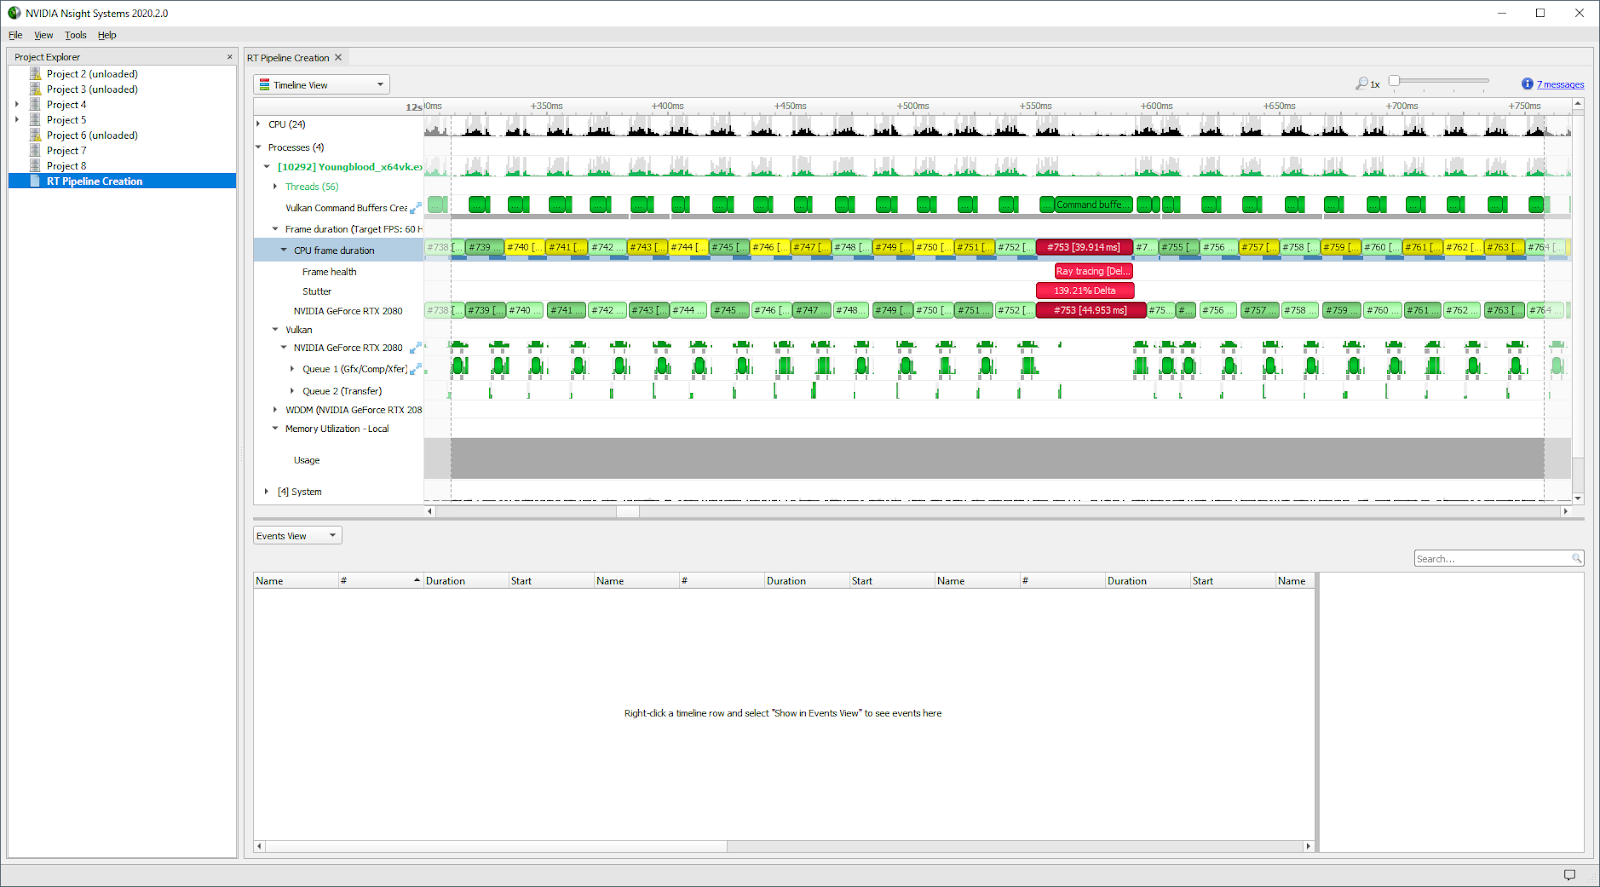
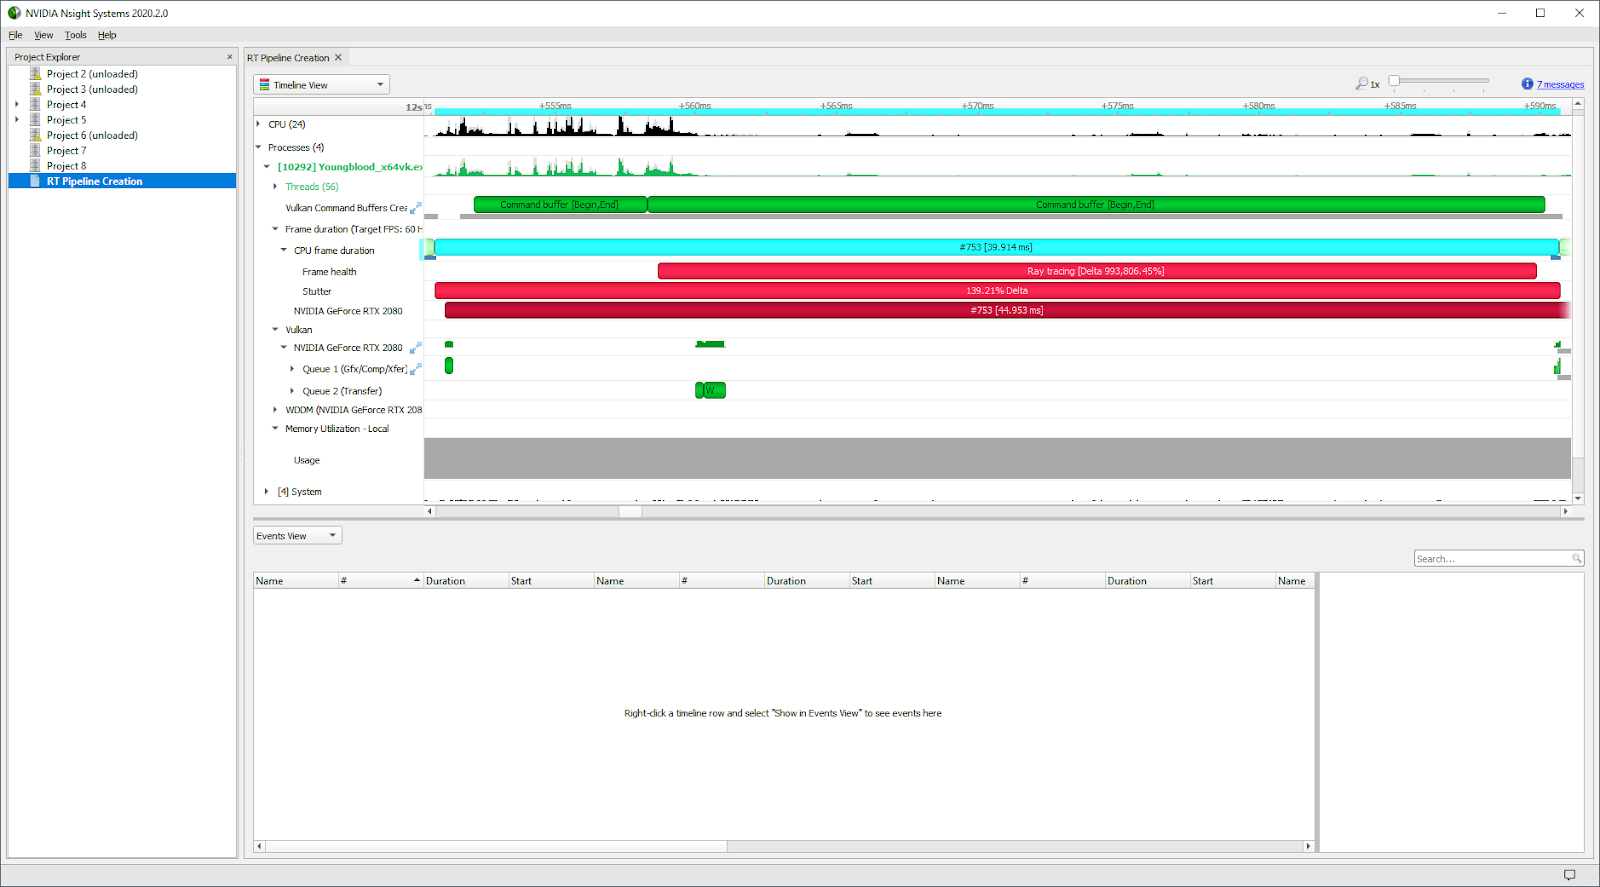
Let’s now zoom on the red frame (#753) by CTRL-double-clicking on it:
Identifying the root-cause of the stutter
In the Frame Health row, hover over the red box. We see the ray-tracing accumulated time in the frame, as shown in Figure 8:
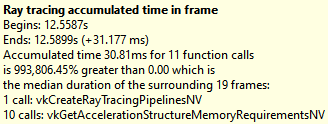
The tooltip can be copied and pasted to text by right-clicking the Frame Health row and selecting the event under Events View in the bottom pane.
So we now know that the root cause of the stutter is calling vkCreateRayTracingPipelinesNV or vkGetAccelerationStructureMemoryRequirementsNV, which add up to 30.8 ms of CPU time in this frame, as measured using instrumented CPU timers for these API calls.
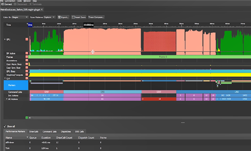
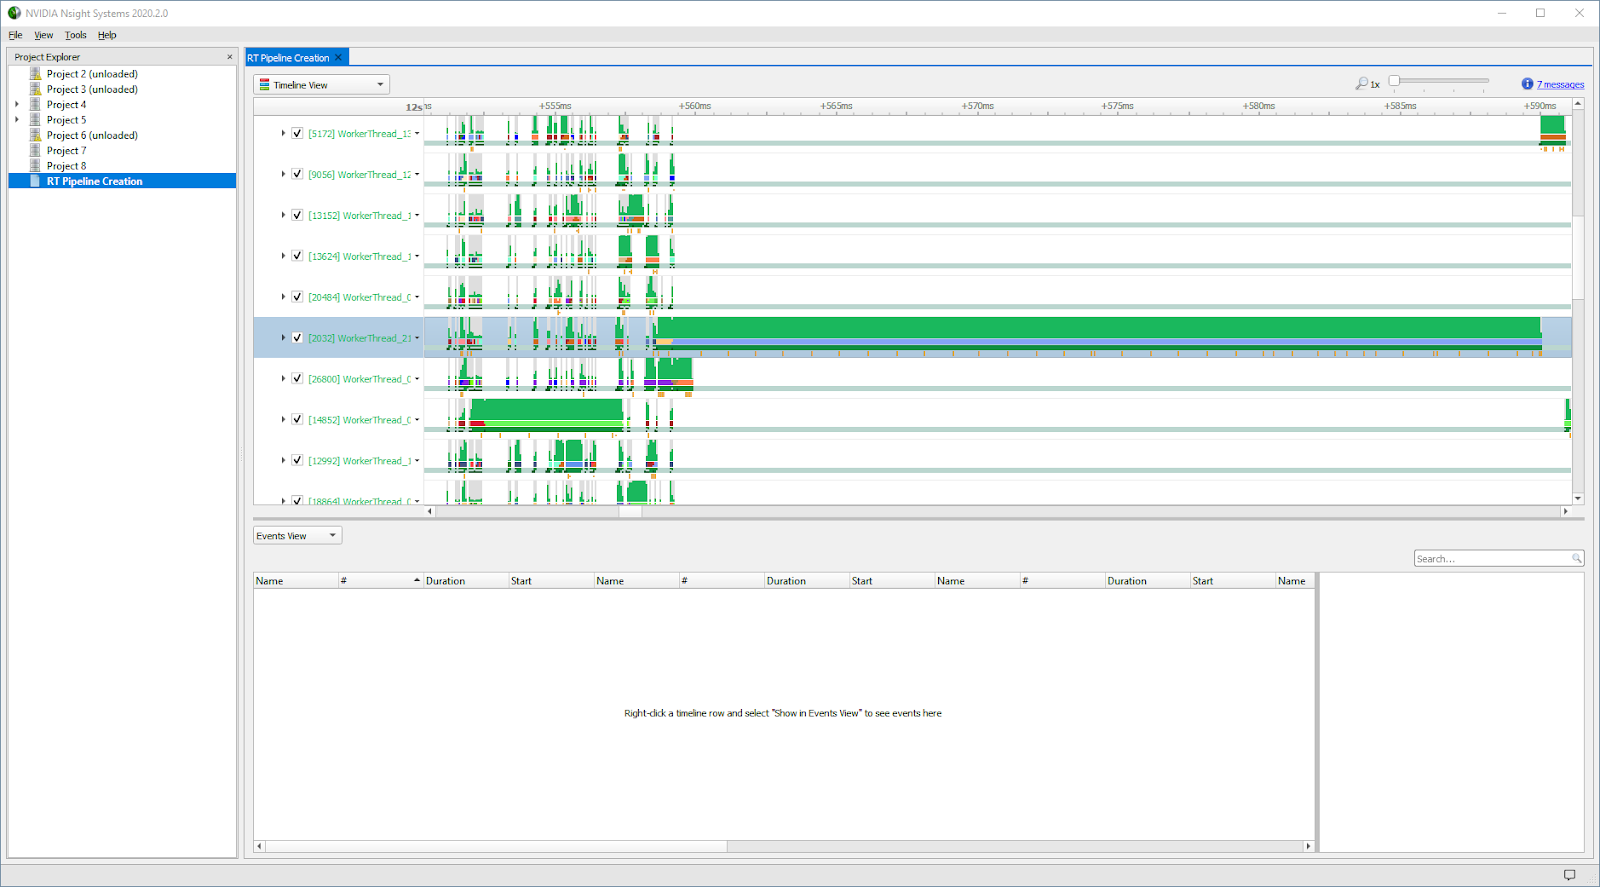
Now, expand all threads. Some less active threads globally may be collapsed into a row labeled N thread hidden. To review those threads, we can double-click that text. Figure 9 shows the long-pole thread in this view:
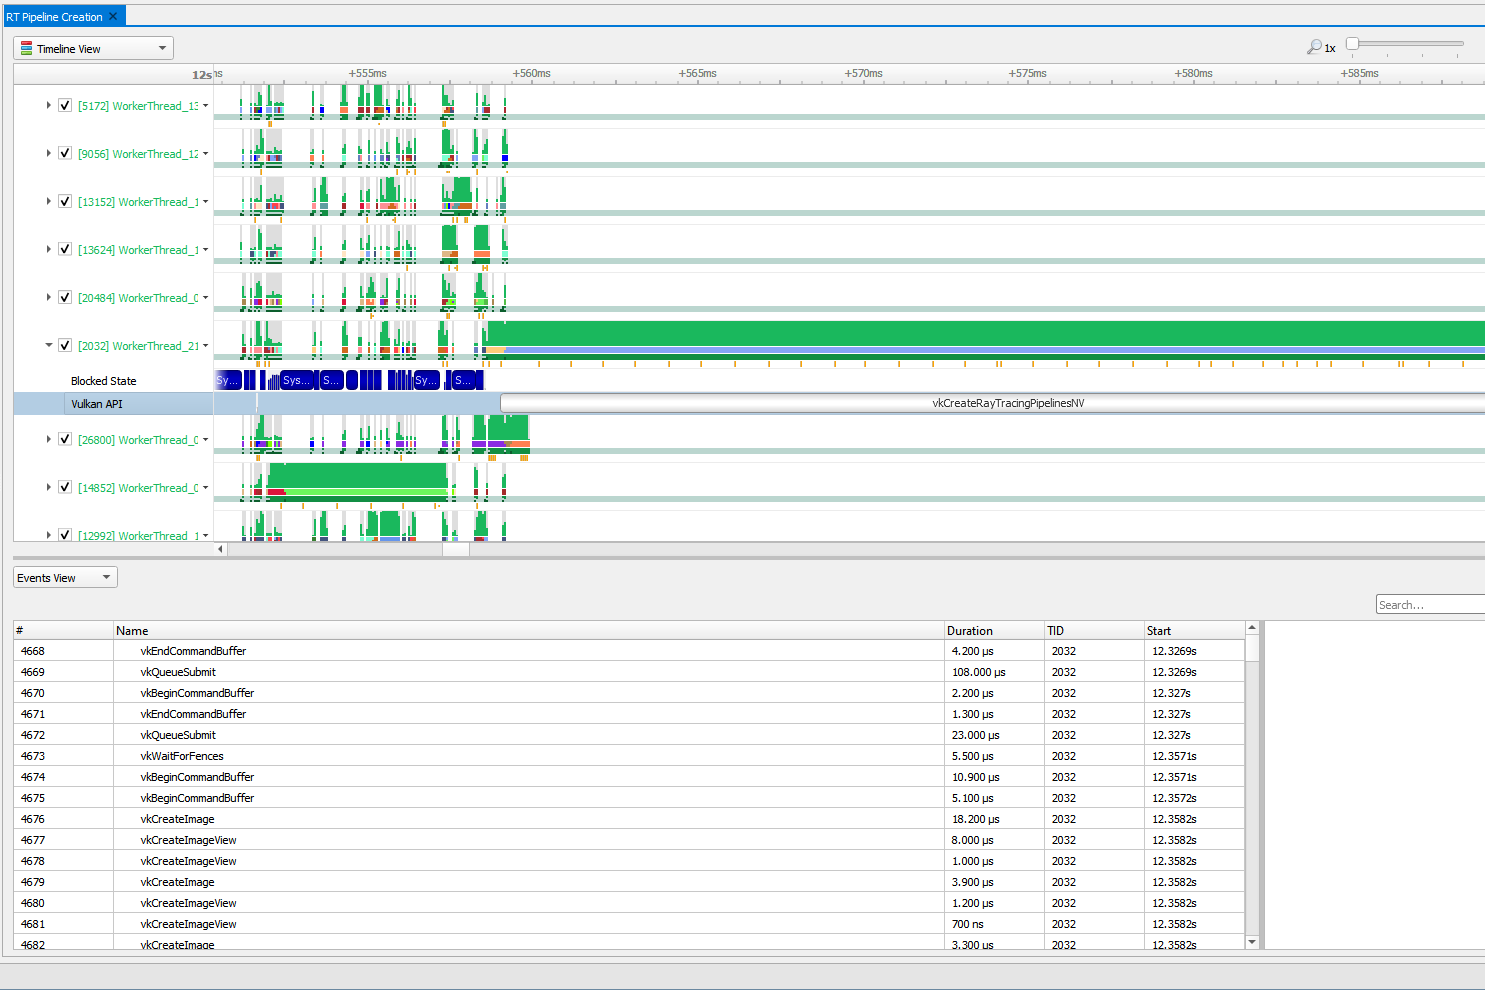
We can now expand that long-pole thread’s details by choosing the triangle icon to the left of the thread label ([2032] WorkerThread_21). We can now clearly see that the root cause of the long-pole thread that caused the stutter is a call to vkCreateRayTracingPipelinesNV, as shown in Figure 10:
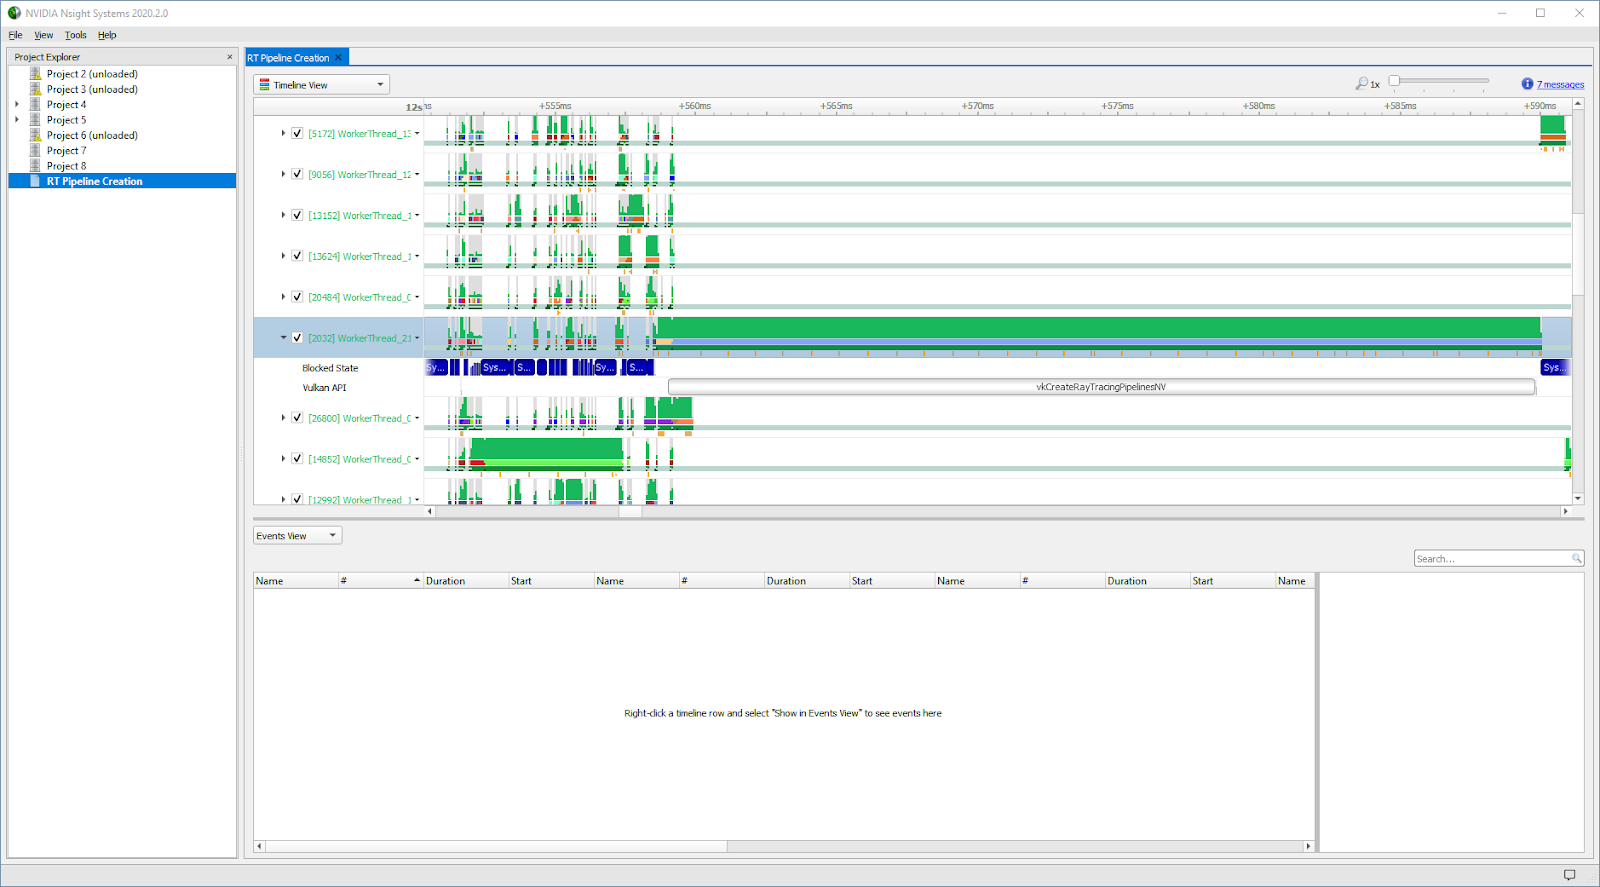
If we right-click the Vulkan API row and choose Show In Events View, we see:
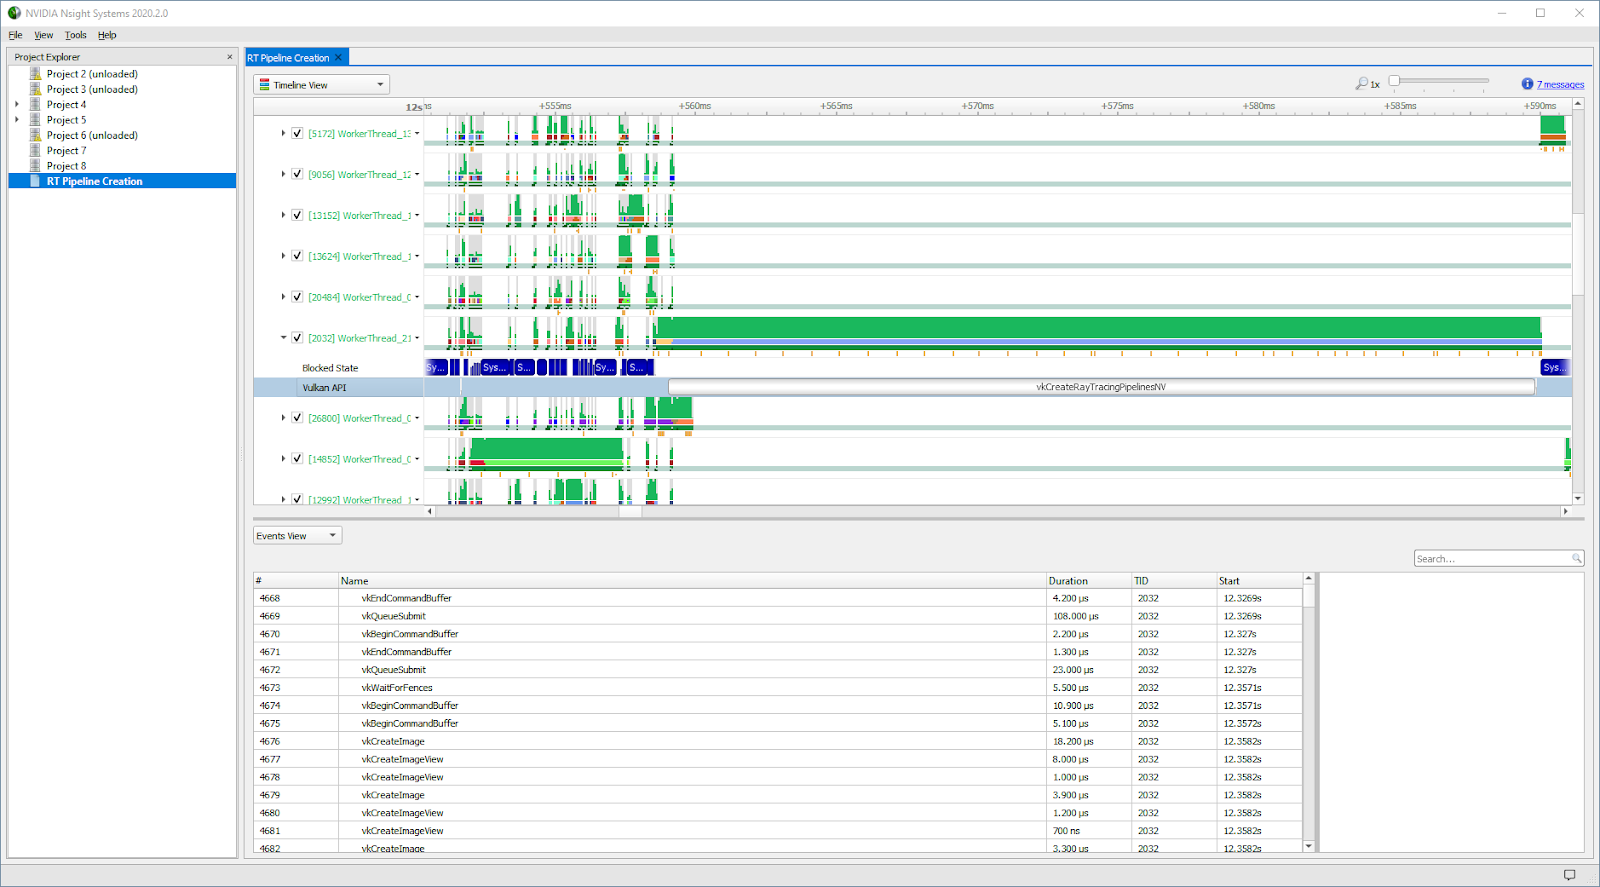
Sorting the events by duration in decreasing order shows the following results, as in Figure 12:
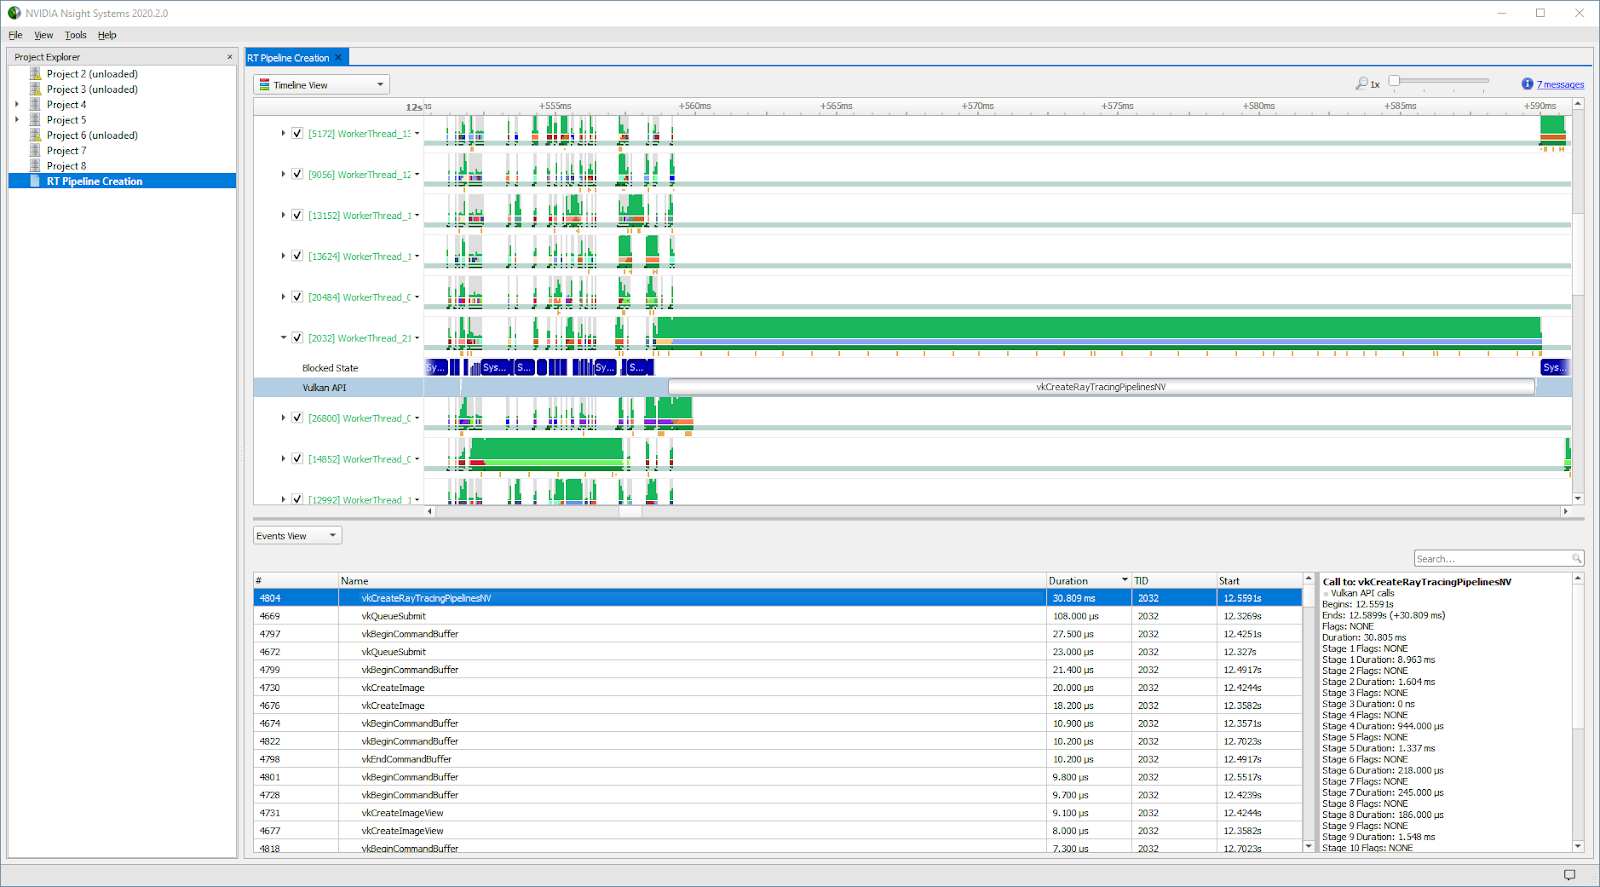
The conclusion is that the Vk API event with the longest duration in this frame is this ray-tracing pipeline creation call taking 30.8 ms of CPU time:
Call to: vkCreateRayTracingPipelines
NV Vulkan API calls
Begins: 12.5591s
Ends: 12.5899s (+30.809 ms)
Flags: NONE
Duration: 30.805 ms
Ray-tracing pipeline creation calls can take a high amount of CPU time because they involve the cost of compiling and linking all the shaders specified in the pipeline. In this case, the fix was simple: at engine initialization time, pre-create all permutations of the ray-tracing pipelines that could possibly be used during gameplay.
Conclusion
Nsight Systems is a powerful tool for determining the root causes of stutters in games. Like GPUView, it can be used to triage any situation where the GPU is idle during a frame due to not being fed data fast enough by the CPU, or due to some graphics API calls triggering expensive CPU work in the driver or operating system.
Finally, unlike GPUView which is available for Windows only, Nsight Systems supports tracing of Vulkan and GL on Linux too. For more information, see the NVIDIA Nsight Systems product page, Nsight Systems – 2019.6 Direct3D11 Feature spotlight video, and other Developer Blog posts such as NVIDIA Nsight Systems Adds Vulkan Support.
Acknowledgements
I want to thank Daniel Horowitz and the Nsight Systems team for their hard work on making this tool more useful to game developers.