
Most people love to travel. The desire to experience something unfamiliar, such as learning about a new culture or meeting different people, is something that probably all of us have felt in our lives. However, travel means making travel arrangements, which usually includes booking a hotel room. Finding a hotel room is however not always simple. Many factors influence our decisions, including budget, reviews, and the way the hotel offer is presented.
This also includes the photos, which try to paint a favorable image of the property while presenting useful information. At hotel.idealo.de, we help people find the right hotel by providing high-quality hotel price comparisons.
Not only the price matters but also the visual aspect
We’ve all heard that “a picture is worth a thousand words”. That definitely applies to our hotel price comparison service. Each hotel supplies us with dozens of images, presenting us with the challenge of choosing the most “attractive” image for each pitch on our offer comparison pages since photos can be just as important for bookings as reviews. Given millions of hotel offers, we end up with more than 100 million images which require an “attractiveness” assessment.
This post presents how we use deep learning to automatically assess the quality of images. In particular, we examine two important dimensions. First, we’ll show you the aesthetic aspect which cares about the visual beauty in the image, which can be quite subjective. Second, we take a look at the technical aspect, which focuses on things such as sharpness, brightness, distortion, and other factors.
How we trained an algorithm to see what’s beautiful
Teaching and training a computer to decide what makes a good hotel photo is a hard problem; it’s even tough for humans. Substantial work has already been done in this field. For example, EyeEm tackled the problem as a classification problem, training a VGG-11 model with a hinge loss on their dataset in triplets form: query, positive, and negative class. Their main idea took advantage of the image similarity which resulted from the ordering in the triplets. Other solutions are presented as regression problems such as the ones used by Expedia.
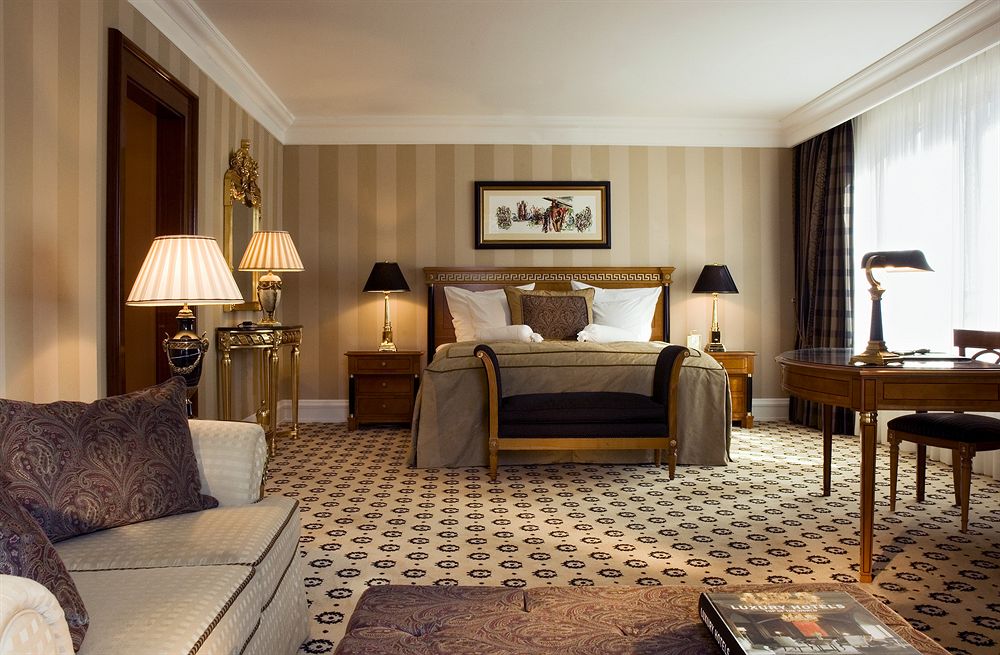
Overall, all the solutions so far only focus on the aesthetic aspect, not really the technical side. Moreover, they also need to a lot of data to train the model, particularly true in EyeEm’s case. These other solutions also fail to consider that one single photo can comprise many different opinions on the visual part since beauty is subjective. For example, in figure 1 we have a hotel bedroom. One person might give it a high rating because the photo actually looks quite nice. Another person might not really like it as there would be too many items in the photo.
To overcome these challenges, we implemented two separate classifiers based on Google’s research paper “NIMA: Neural Image Assessment” [Talebi and Milanfar 2017]. NIMA consists of two Convolutional Neural Networks (CNNs) that aim to predict the aesthetic and technical quality of images, respectively. The code for our implementation can be found on Github.
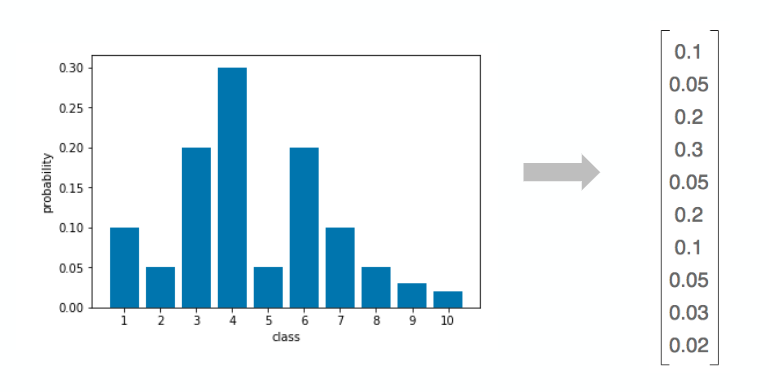
The special feature of NIMA is the use of the Earth Mover’s Loss (EML) as the loss function, which differs from the Categorical Cross Entropy (CCE) loss generally applied in Deep Learning classification tasks. The EML can be understood as the amount of “earth” that needs to be moved to make two probability distributions equal, as shown in figure 2. A useful attribute of this loss function is that it captures the inherent order of the classes.
For our image quality ratings, the scores 4, 5, and 6 are more related than 1, 5, and 10. In other words, we want to punish a prediction of 4 more if the true score is 10 than when the true score is 5. CCE does not capture this relationship, which is often not required in object classification tasks (e.g. misclassifying a tree as a dog is as bad as classifying it as a cat).

Training
We tried transfer learning in an early iteration to train our aesthetic and technical classifiers on two public datasets, the AVA dataset [Murray et al. 2012] for the aesthetic model and the TID2013 dataset [Ponomarenko et al. 2013] for the technical model. We used the MobileNet architecture with ImageNet weights for the model and replaced the last dense layer in MobileNet with a dense layer that outputs to 10 classes (scores 1 to 10). We also used VGG16 but dropped it due to slower inference speed.
In order to use the EML in the NIMA model, we need a distribution of ratings across all ten score classes for each image. For the AVA dataset, used to train the aesthetic classifications, these distribution labels already exist whereas for the TID2013 dataset, we needed to infer the distribution used for technical classifications from the mean score given for each image. For more details on our distribution inference check out our GitHub repo. The inferred distributions then form the ground truth labels used for training, as depicted in figure 3.
Fine-tuning stages
We train the models in a two stage process:
- We start by training only the last dense layer with a higher learning rate. This ensures that the newly added random weights are adjusted to the ImageNet convolutional weights. This burn-in period mitigates the risk of juggling around the convolutional weights at training start and consequently slowing down the training process.
- After the burn-in period we train all weights in the CNN with a low learning rate, as figure 4 shows.
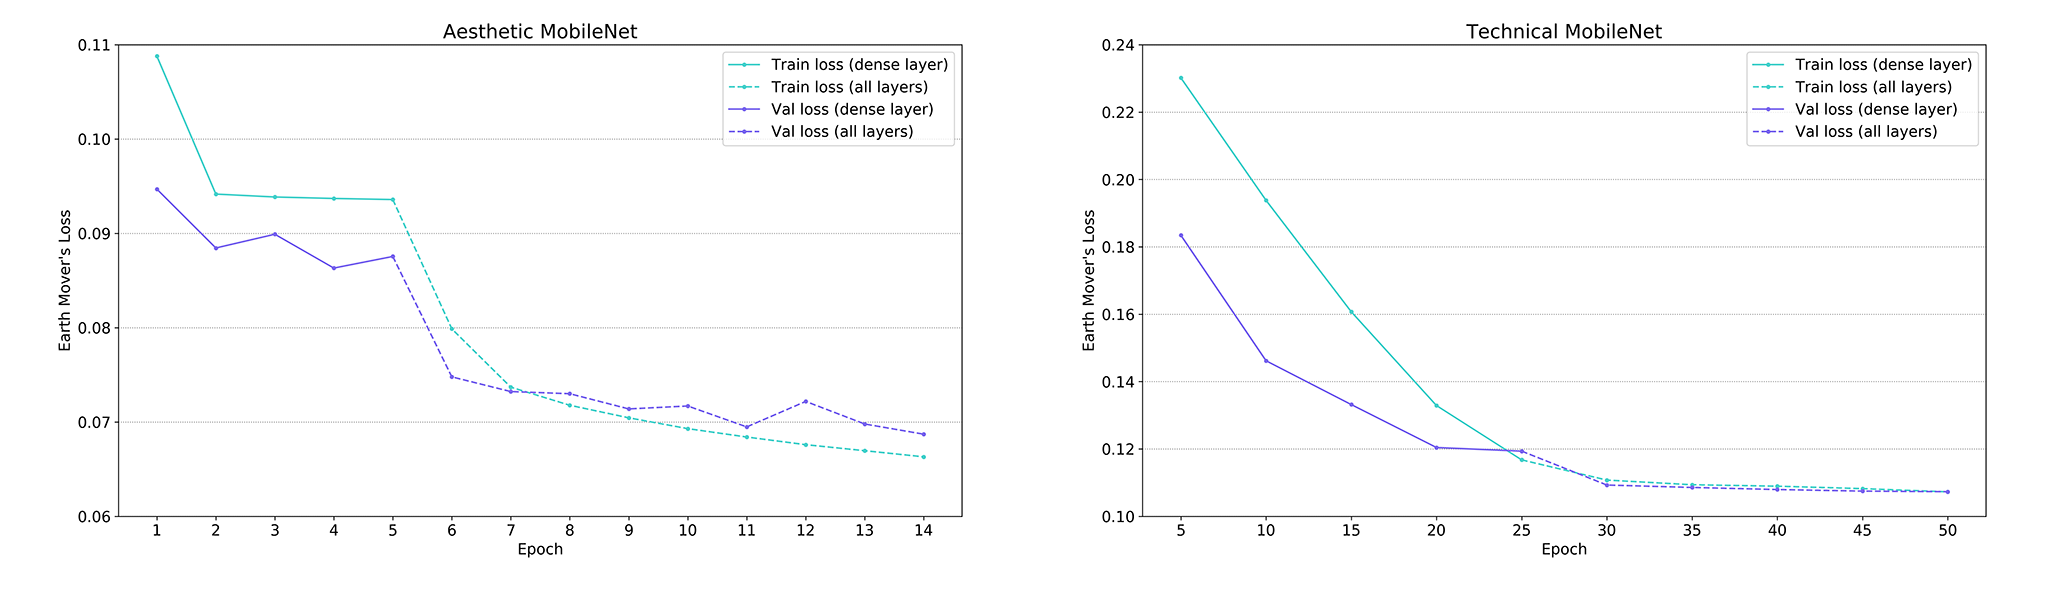
The train and validation losses for both the aesthetic and technical model level out after 5 and 25 epochs, respectively. This provides a good indicator that the newly added weights have learned to classify aesthetic and technical quality as good as possible, all of which means it is time to start training all weights.
A significant drop in loss occurs for the aesthetic classifier once we also start training the convolutional weights (dashed lines in left graph above). This indicates that we adjust the convolutional weights significantly for the aesthetic classification task. The drop in loss is smaller for the technical classifier, which seems counterintuitive, since the technical image quality should be object agnostic and the ImageNet weights are optimised to recognise objects. The small drop might be due to the very small learning rate required to regularise training on the small TID2013 dataset.
You can find all hyper-parameters used for training on our GitHub repo.
Infrastructure
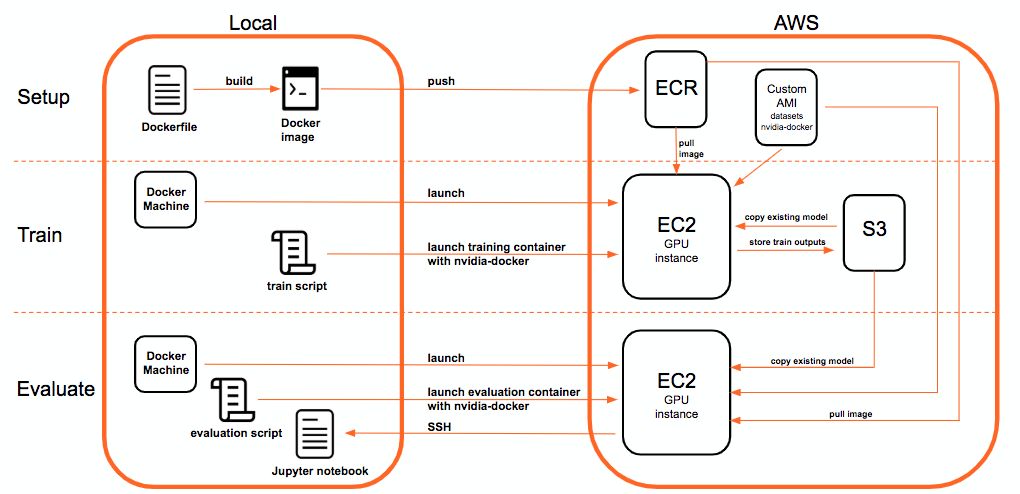
We used Keras and Tensorflow as our main backend for training the models. We further containerized everything into Docker and then trained it on AWS using the p2 (NVIDIA Tesla K80) and p3 (NVIDIA V100) instance. GPU support enabled us to achieve a 30-fold speedup in training time versus CPU. Figure 5 describes our training and evaluation workflow which we also open-sourced on Github. Basically, we launch an EC2 instance with Docker Machine and then train the model via a remote EC2 training script. After the training is done, the training outputs (logs and best model weights) are stored on S3 in a time stamped folder. This model can then be used for evaluation.
Results
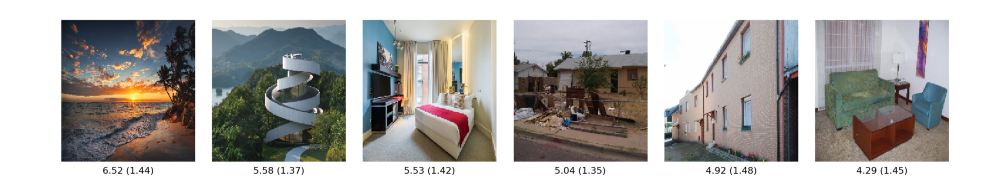
The predictions shown in figure 6 indicate that the aesthetic classifier correctly ranks the images from very aesthetic (leftmost image with sunset) to least aesthetic (boring hotel room on the right).
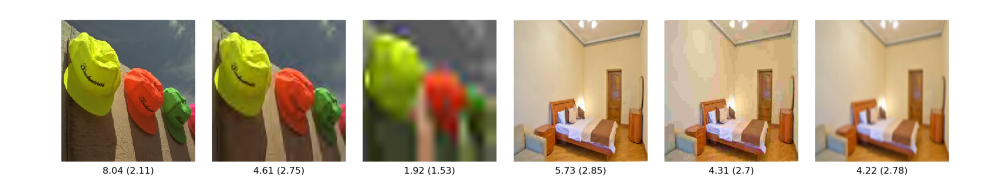
Similarly for technical classifications, the classifier predicts higher scores for undistorted images (first and fourth image from left), versus images with jpeg compression (second and fifth) or blur (third and sixth), as you can see in figure 7.
Hotel specific data is key to our model
Training the aesthetic and technical classifiers on public datasets already gave us quite impressive results. However, we’ve recognized that applying it to our hotel images could be problematic, since it lacked some kind of domain-specific learning pertinent to the aesthetic model. For example, figure 8 shows the ranking for hotel bedrooms. Although the ranking seems to be correct in terms of visual aspect, you can see that the distance from the best image to the worst image is relatively small. This can be quite problematic in production as there’s no clear boundary for determining a good image, for example, is the score 8 a good hotel image or is 5 a good score?
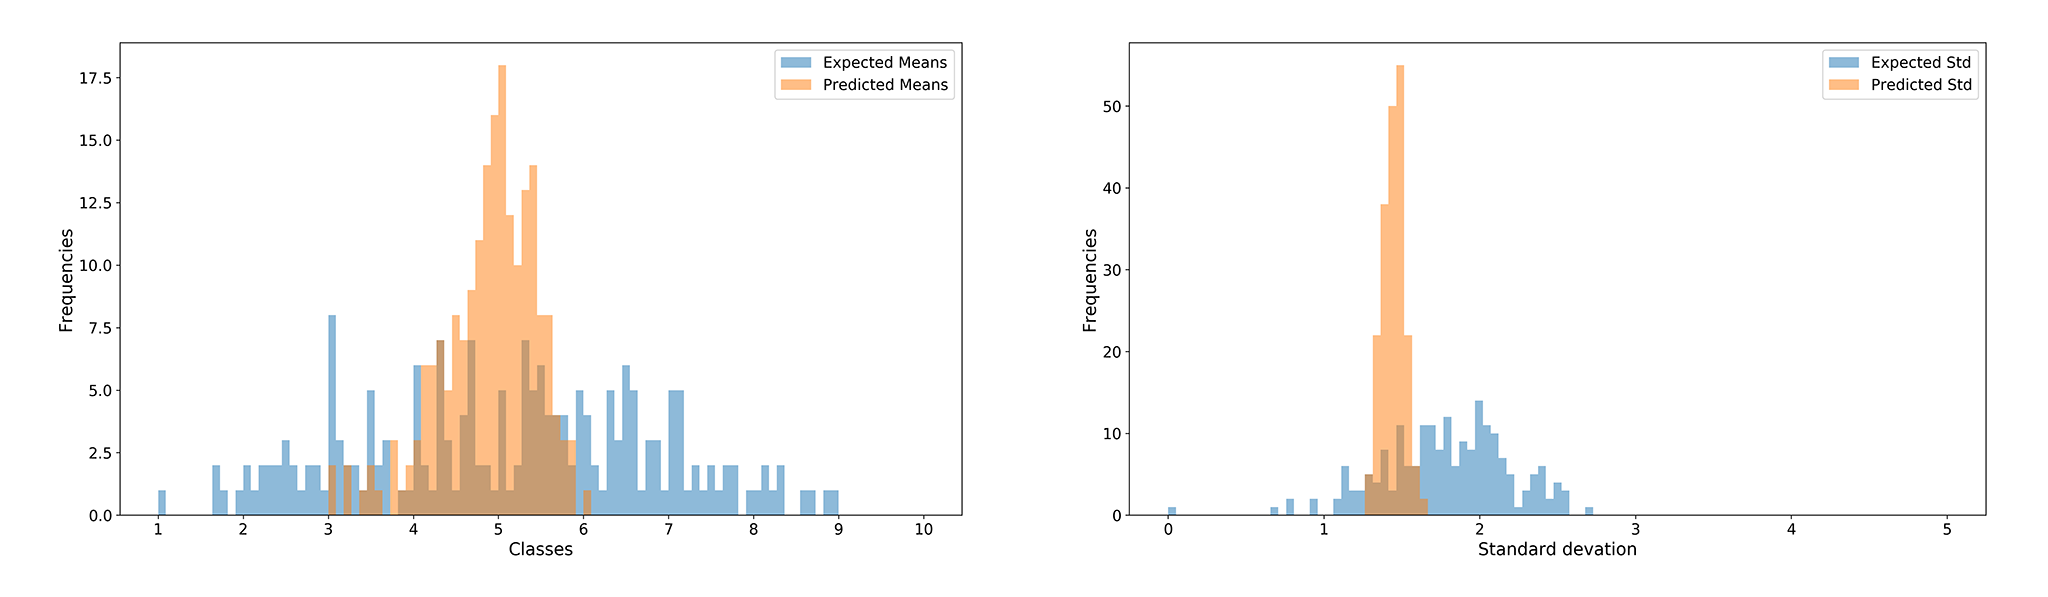
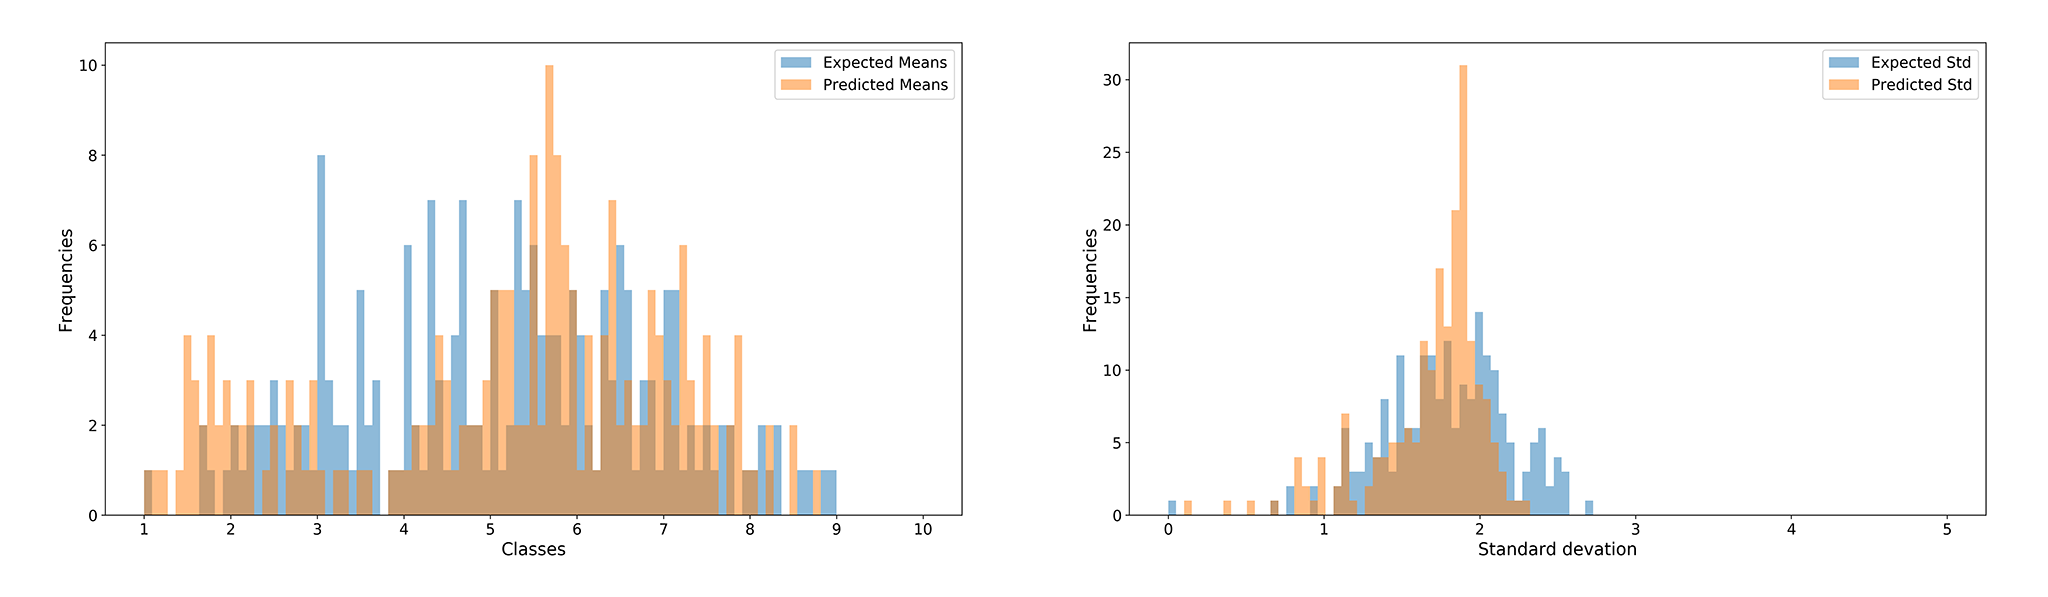
This result can also be seen in figure 9. The model doesn’t seem to capture classes with very high or low ratings but is more tied in the center between class 4 to 6.
Another problem with transfer learning can be seen in figure 10. The image with the best ranking is a view from the balcony. Sometimes some listings with restrooms rank as the best images. Although visually there is no problem with it, we rather want to have the living room or sleeping room as the first image. This problem occurs because the model is trained on the AVA dataset, which not only includes photos with rooms but also photos with categories like food, landscape, people and many more others. Therefore, we decided to further fine-tune our model with self-labeled data.

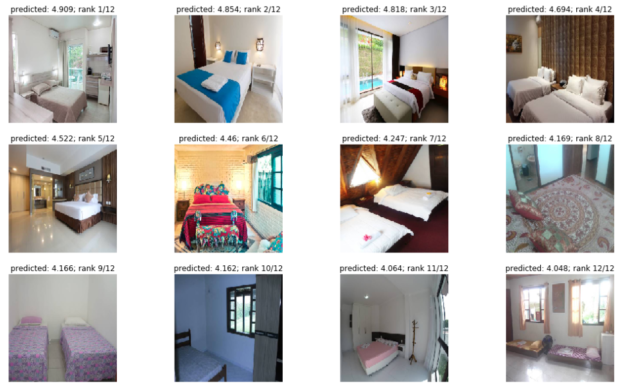
We created a simple labeling application and collected aesthetic ratings for 1000 images. We then fine-tuned the aesthetic model on 800 training images and then evaluated it on the rest. Our next iteration enabled us to clearly cover the higher and lower classes well, as shown in figure 11, which resulted in a better discriminatory power.
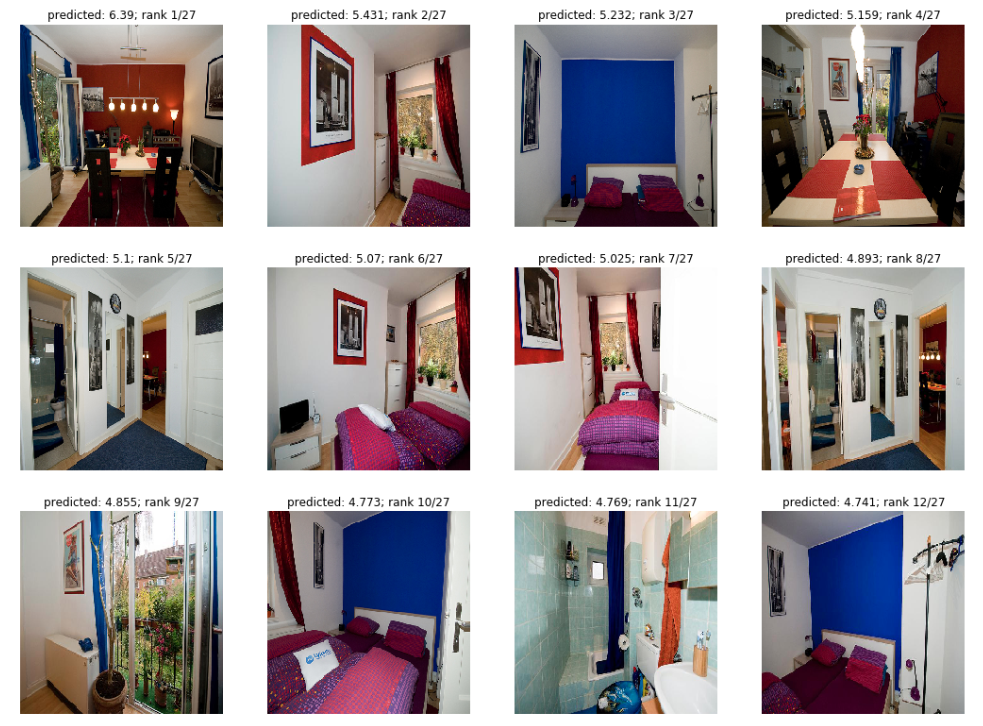
Moreover, when applying the model with our hotel specific data, figure 12 shows a much better ranking compared to the results we got in figure 10. The best image now shows a nice cozy living room instead of a view from the balcony, which doesn’t appear in the top 12 images.
Interpreting neural networks
Deep neural networks work impressively well on many computer vision tasks. However, interpreting those results is generally difficult given their black-box nature. In order to gain a better understanding as to how the CNN assesses aesthetics for an image, we visualised the learned convolutional filter weights and output nodes in Aesthetic MobileNet. We used the awesome Lucid library for all visualisations.
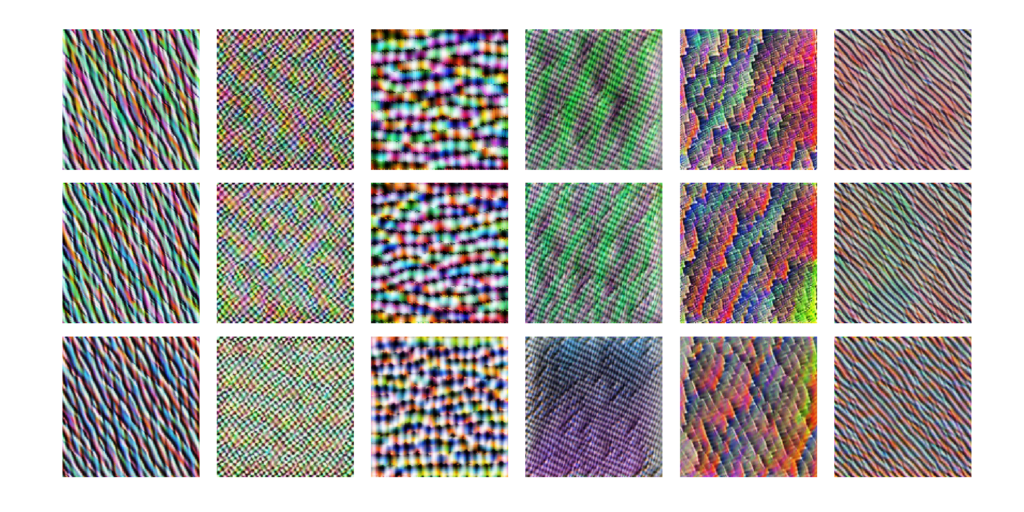
Earlier convolutional layers are generally associated with simpler structures, like edges, wave patterns, and grids. The images above in figure 13 show patterns associate with six filters in layer 23 of MobileNet:
- The six images in the top row are generated from the original MobileNet ImageNet weights (ImageNet MobileNet)
- The middle row images are generated from the MobileNet weights fine-tuned on the AVA dataset for aesthetic ratings (Aesthetic MobileNet first iteration)
- The bottom row images are from the second iteration MobileNet Aesthetic
We can see from the filter visualisations that the earlier convolutional filters are little affected throughout fine-tuning, since they are very similar to the original ones.
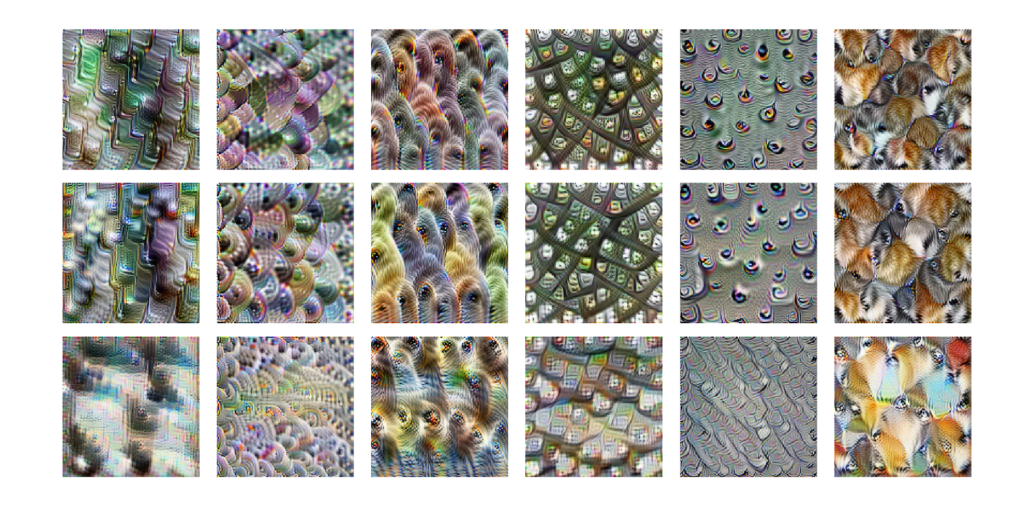
The learned shapes are more complex for mid convolutional filters shown in figure 14. They resemble interwoven structures like fur or a grid with eyes. At this level, the filters only seemed markedly affected in the second iteration model.
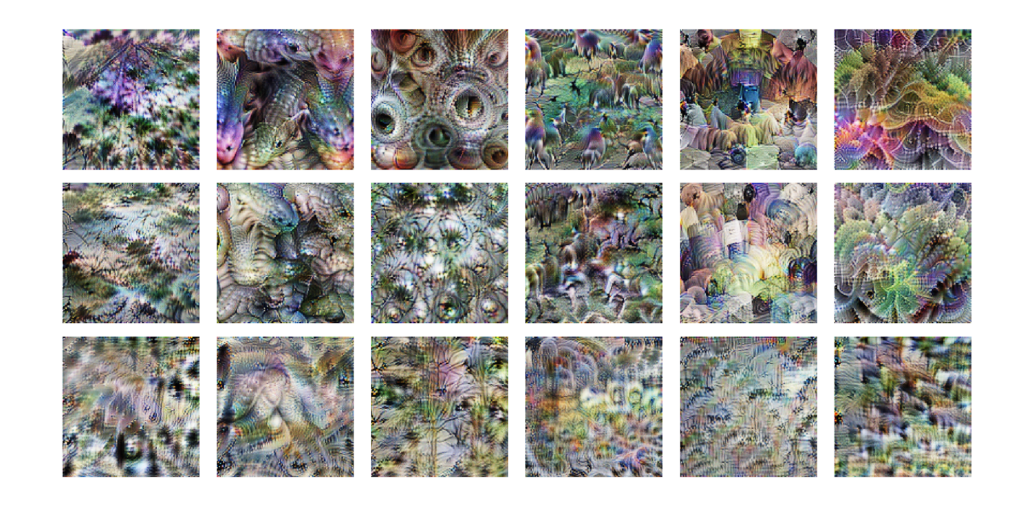
The later convolutional layers in figure 15 show even more complex structures that resemble animals and tree like shapes. We can see that the filters for Aesthetic MobileNet differ significantly from the ImageNet ones, as they seem to be less focussed on objects, e.g. no animal shapes in the fourth filter from the left.
Our learnings
In this article, we presented our business challenge for automatically assessing the quality of images in both aesthetic and technical dimensions. We showed that trained aesthetic and technical models could successfully rank images according to aesthetic and technical quality. We also concluded that transfer learning is great way to bootstrap deep learning projects. However, domain specific data proved to be the key to improve our results. Moreover, we learned that not much additional data is needed to fine-tune our model as opposed to other solutions used so far. We also open-sourced our code.
Check out our repo on Github if you’re interested to try it out.
This article was originally published on Medium and we modified it for NVIDIA’s developer blog.
References
[Talebi and Milanfar 2017] NIMA: Neural Image Assessment, arXiv:1709.05424, 2017
[Murray et al. 2012] AVA: A Large-Scale Database for Aesthetic Visual Analysis, Computer Vision and Pattern Recognition (CVPR), 2012
[Ponomarenko et al. 2013] Color image database TID2013: Peculiarities and preliminary results, European Workshop on Visual Information Processing (EUVIP) 2013
Acknowledgments
This is joint work with Hao Nguyen.