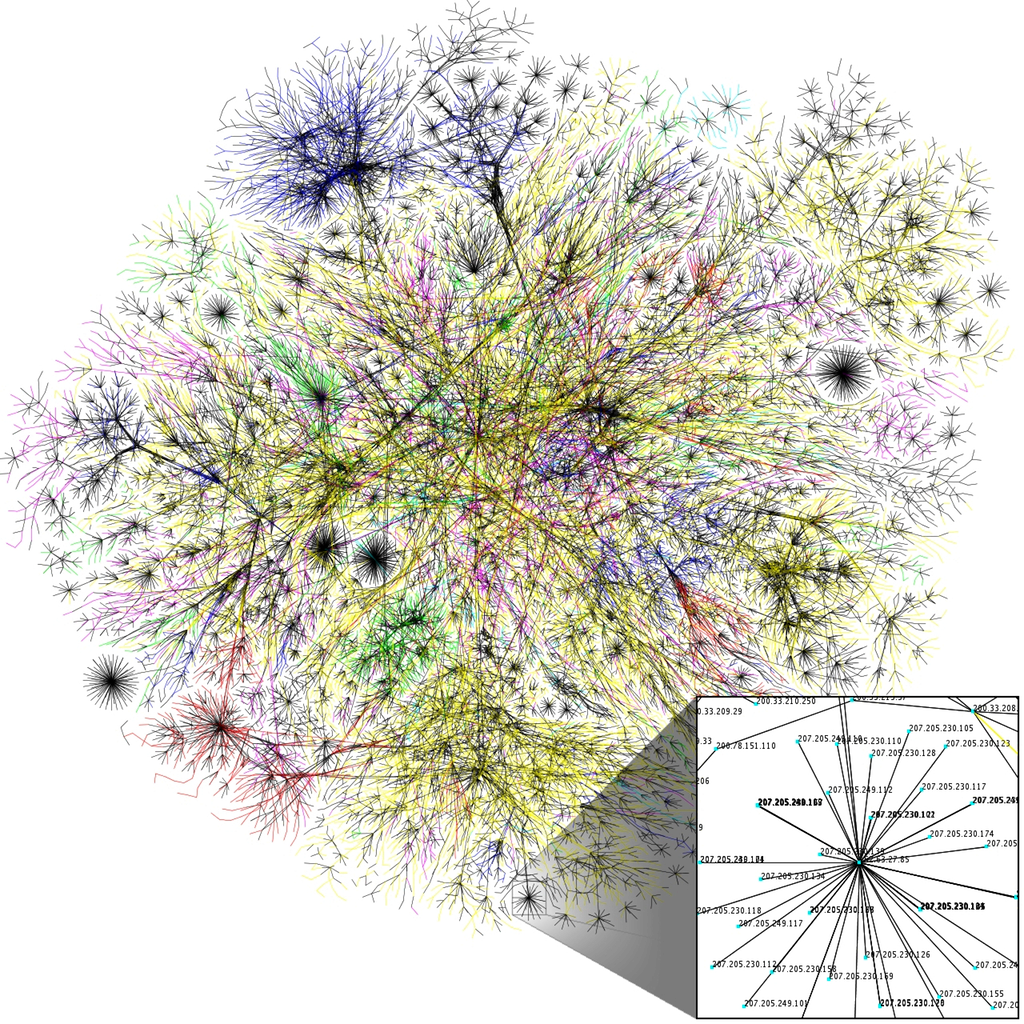
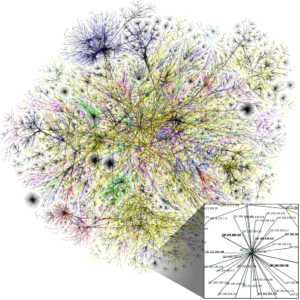
Did you see the White House’s recent initiative on Precision Medicine and how it is transforming the ways we can treat cancer? Have you avoided clicking on a malicious website based on OpenDNS’s SecureRank predictive analytics? Are you using the Wikidata Query Service to gather data to use in your machine learning or deep learning application? If so, you have seen the power of graph applications. Graphs are not just nodes and links, they are powerful data structures you can use to represent complex dependencies in your data. Graph applications are everywhere, ranging from cancer research to large-scale cyber threat detection to collaborative filtering recommendation systems. Social networks, protein networks, and communication networks are all examples that can benefit from graph-based techniques.
The trick is that you can’t use the same techniques for graphs as for other big data challenges. Many applications make great use of the processing power of GPUs. In the world of data-intensive analytics, however, memory bandwidth—not processor speed—is the primary performance limiter. Because graph algorithms exhibit non-locality and data-dependent parallelism, when you traverse a large graph you are constantly paging from main memory. For these problems, GPUs provide superior bandwidth to memory and can deliver significant speed-ups over CPUs.
Unless you’ve been heads down performance tuning your CUDA code for the last year, you’ve seen the buzz around GPU-accelerated big data analytics. We foresee the trend of increasing memory bandwidth and the arrival of NVLink and Pascal enabling faster and easier multi-GPU computing. So how do you apply all that bandwidth for graph analytics?
At BlazeGraph, our answer is to build software that exploits the bandwidth advantages of GPUs to accelerate graph and predictive analytics. In this blog post, I will describe our journey so far and show you where we’re heading in the future.
Our Journey to Graphs on GPUs
In 2013, we started working on the DARPA XDATA program. This lead to the development of MapGraph, a high-level API for GPU-accelerated graph analytics, in 2014. We first started using libraries like moderngpu, cub, and others in our software, which we still use today. Building on prior success in scalable graph traversal on GPUs, which showed the potential for graphs on GPUs and with DARPA funding, we collaborated with the University of Utah SCI Institute to extend MapGraph to run on multi-GPU clusters. At the IEEE Bigdata conference later in 2014, we demonstrated a breadth-first search (BFS) on a Graph 500 scale 27 (4.3 billion edges) graph at a rate of 29.1 billion traversed edges per second (GTEPS) running on a cluster of 64 NVIDIA K40 on the PSG Cluster.
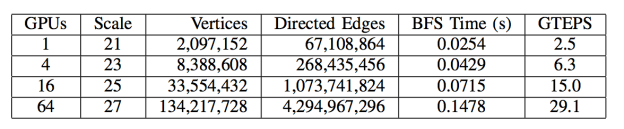
At the time, we had the world’s fastest BFS result for 64 GPUs. If you look at GTEPS in terms of performance over hardware cost, the multi-GPU solution provides as much as a 10x advantage over a comparable supercomputer. In 2015, we continued to develop this technology, consolidating it with our open source graph database platform. We announced our new GPU-accelerated product, now called Blazegraph, in December 2015.
GPU Graph Performance is Smoking
Given the great rise in interest in and uptake of Apache Spark for large scale data processing in 2015, we were curious about how GPUs compared to Spark performance. We did a comparison of our multi-GPU implementation of BFS to a Spark implementation in Scala using GraphX, the Spark graph processing framework. We used the ICWSM 2010 Twitter dataset, which has 1.9 billion edges. We compared to several different CPU-based configurations. The first was a single “fat” node with dual K-80s on which we processed a 700 million-edge subset of the data. The second and third were a 16-node cluster of Amazon EC2 instances of type r3.2xlarge (488 GB of RAM) and a 16-node cluster of r3.4xlarge (1,952 GB of RAM), respectively. We compared these to a cluster of 16 K40s (192 GB of RAM) using the full 1.9B edge graph. Note the relative differences in the amount of RAM between the CPU and GPU clusters. Figure 3 shows the GPU speedups we achieved.
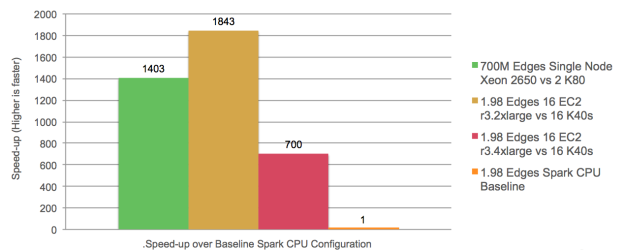
In all cases, the multi-GPU solution was 700-1800X faster than the CPU-based Spark implementation. The comparisons are taken only for the execution of the BFS graph traversals. We took extra care to make sure that Spark RDDs were forced into memory (MEMORY_ONLY_SER) for the comparison. We first presented these results at Super Computing 2015. While this result is impressive, it was not unexpected. Spark and GraphX have a stated design tradeoff to “achieve a balance between expressiveness, performance, and ease of use”. When we compare to optimized, multi-core CPU implementations, our own results show 3.9X to 100X speedups. These results are true even at a very large scale where others have shown 7.8X speedup on clusters of 4096 GPUs.
However, what really excites us is where Spark succeeds wildly—in making it easy for you to load large data sets and quickly develop complex analytics. You can be up and running graph analytics on a Spark cluster in only a few minutes. It’s a bit more complicated to set up a GPU cluster and run PageRank. What if you could get the full speed of CUDA and GPUs through an environment like Spark?
“Did You Hear the One About the Analytics Developer Who’s Also a Parallel Programmer?”

So, GPUs are fast; very fast for graph processing and analytics where memory bandwidth is a bottleneck. Great; we can get over 100x acceleration by moving to GPUs. Let’s go find some analytics developers and business analysts to develop algorithms for these multi-GPU clusters. As we discovered, overcoming the technical challenges of processing graphs on multi-GPU systems is just the beginning. We’ve found that individuals with the combination of expertise to understand a business problem and build an algorithm to improve it, often do not have the set of skills required to optimize the implementation on a multi-GPU system; and vice-versa.
It is non-trivial to scale applications onto multi-core, parallel architectures. GPU algorithms development requires significant knowledge of CUDA and the CPU and GPU memory systems. We saw a need to both accelerate existing high-level APIs for graph query and to enable iterative graph analytics at a high level, while delivering the speed of CUDA and multi-GPU systems.
GPU Acceleration for Graph Query
Before we became GPU-junkies, we were graph nerds (still in recovery). The SPARQL language is the W3C standard query language for graph data represented using the Resource Description Framework (RDF). You can think of it much like SQL for graphs. Our Blazegraph DB open-source platform provides a non-GPU implementation of a graph database that supports RDF and SPARQL as well as the Tinkerpop APIs for property graphs. Blazegraph GPU is our new capability that provides GPU-acceleration for SPARQL queries based on our existing platform. We’ve just started shipping this in Q1 2016 to our first customers. If you’re going to be at GTC this year, check out our talk to find out about this capability on the Cirrascale Cloud.
We benchmarked our GPU-accelerated version using the Lehigh University Benchmark (LUBM). LUBM is a well-known graph benchmark using extensional queries over a large data set. It generates synthetic data that models a university structure: students take courses, courses are taught by professors, and so forth. The benchmark provides a set of 14 queries. Query #9 is an example of a conjunctive query that is one of the most challenging in the benchmark:
SELECT ?x ?y ?z
WHERE{
    ?x a ub:Student .
    ?y a ub:Faculty .
    ?z a ub:Course .
    ?x ub:advisor ?y .
    ?y ub:teacherOf ?z .
    ?x ub:takesCourse ?z .
}
This is a conjunctive query that asks, “Show me all of the students who take a course taught by a faculty member who is also the student’s advisor.” We ran the benchmark using the LUBM 1000 University synthetic data, which contains 167,697,263 edges. This size is the largest LUBM configuration that will fit on the memory of a single K40 (or half of the memory on a K80 accelerator). We compared the performance of our non-GPU platform (“core”), our GPU-accelerated platform (“GPU”), and a cpu-only version of the operators (“CPU”) that implement SPARQL queries. The following table shows the results for all 14 queries.
| average runtime [ms] | Speedups (pos. numbers indicate gain) | |||||
| U1000 | blazegraph core | blazegraph CPU | blazegraph GPU | GPU vs. core | CPU vs. core | GPU vs. CPU |
| query1.txt | 27 | 34 | 45 | -40.74% | -20.79% | -25.19% |
| query10.txt | 26 | 31 | 36 | -27.78% | -16.13% | -13.89% |
| query11.txt | 33 | 56 | 35 | -5.66% | -40.12% | 57.55% |
| query12.txt | 32 | 46 | 43 | -25.58% | -29.93% | 6.20% |
| query13.txt | 25 | 33 | 39 | -35.04% | -24.00% | -14.53% |
| query14.txt | 21 | 29 | 24 | -11.27% | -27.59% | 22.54% |
| query2.txt | 111235 | 59729 | 134 | 83118.20% | 86.23% | 44584.79% |
| query3.txt | 29 | 35 | 39 | -25.86% | -17.31% | -10.34% |
| query4.txt | 48 | 48 | 66 | -27.27% | 0.00% | -27.27% |
| query5.txt | 44 | 48 | 42 | 3.15% | -9.03% | 13.39% |
| query6.txt | 27 | 23 | 24 | 12.50% | 19.12% | -5.56% |
| query7.txt | 47 | 47 | 58 | -18.86% | 0.00% | -18.86% |
| query8.txt | 123 | 233 | 61 | 102.75% | -47.13% | 283.52% |
| query9.txt | 25450 | 73077 | 228 | 11078.77% | -65.17% | 31998.39% |
| total [ms] | 137167 | 133468 | 873 | 15606.18% | 2.77% | 15182.56% |
| total [s] | 137.17 | 133.47 | 0.87 | |||
| total [m] | 2.29 | 2.22 | 0.01 | |||
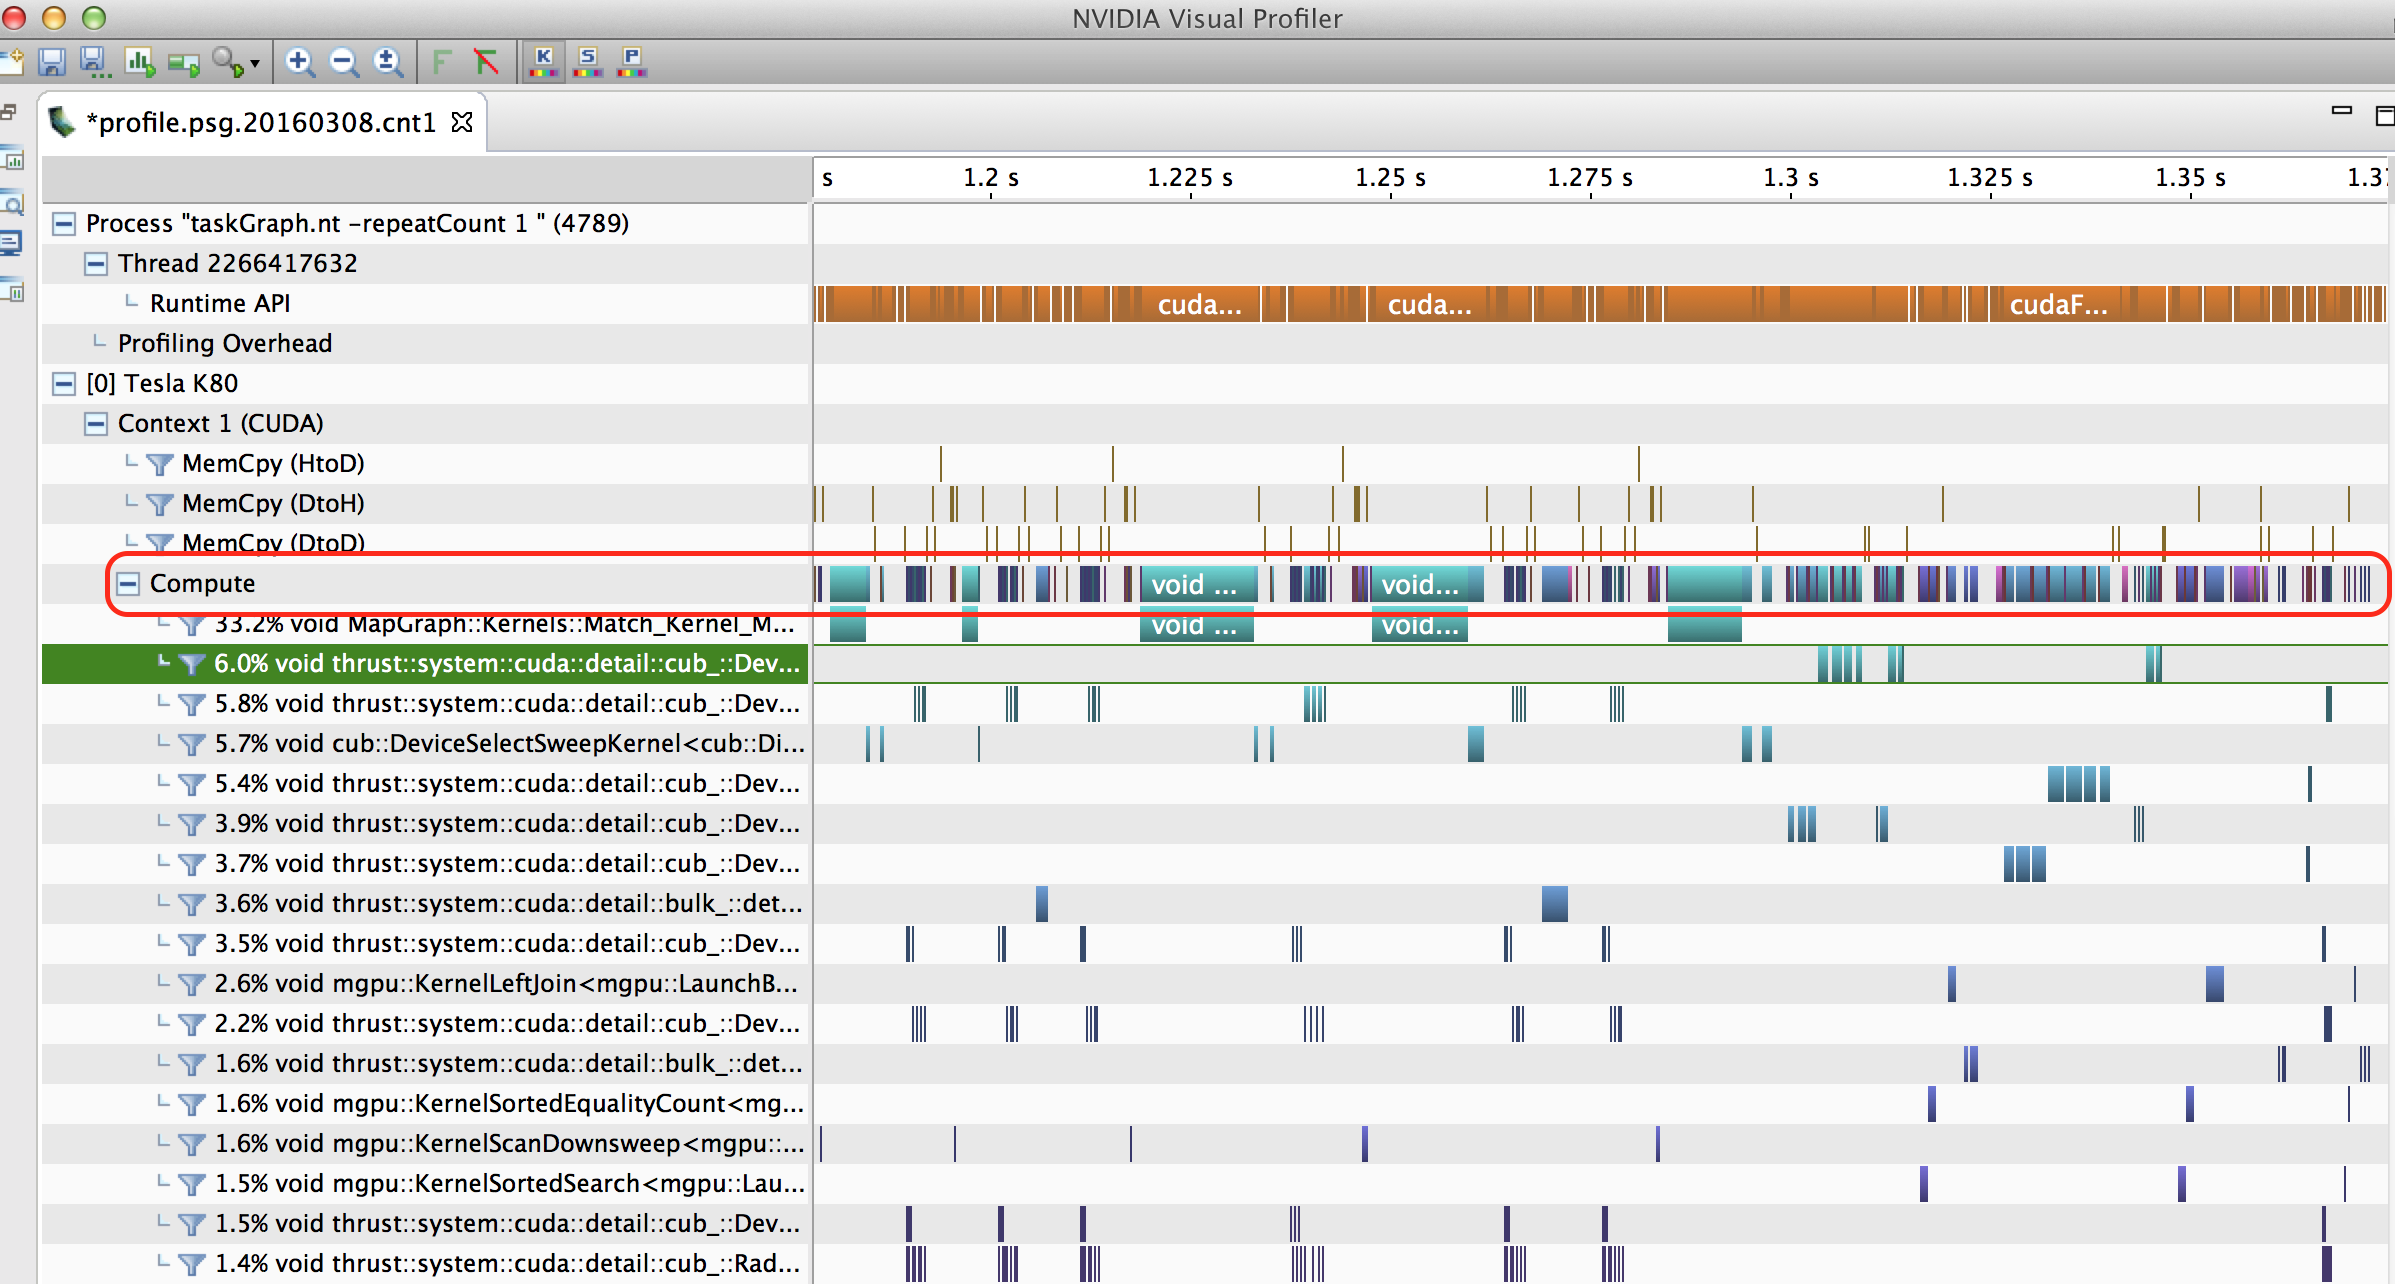
You’ll see that overall for Query 9, the example above, we have a 110X speedup over our non-GPU core version. Over all of the queries, our GPU platform was on average 156X faster than the non-GPU version. This means that you can realized 150X performance improvement for your existing graph database just by adding a GPU. That’s not too bad, but if you look at the “compute” execution line for Query 9 in the NVIDIA Visual Profiler in Figure 4, you’ll see that there’s lots of room for performance tuning (gaps in the timeline) using different memory allocation approaches such as cnmem.
GPU Acceleration for Iterative Graph Analytics
 Graph query is an important capability, but many algorithms such PageRank also need iterative graph traversal capabilities. To solve this challenge, we developed DASL (pronounced “dazzle”). DASL is an acronym for a Domain specific language for graphs with Accelerated Scala using Linear algebra (quite a mouthful). With DASL, we provide a binding to the Scala programming language for graphs and machine learning algorithms. Blazegraph DASL is our system that executes DASL programs by automatic translation into program code that is optimized for GPUs. DASL enables you to implement complex applications that efficiently run on GPUs, without the need for parallel programming expertise or low-level device optimization.
There is a significant amount of work with graphs as matrix representations and graph algorithms as operations on those matrices. You can easily represent graphs as adjacency or incidence matrices. A duality with Linear Algebra (LA) operations over the matrices that represent fundamental graph operations enables recasting many graph algorithms—such as Louvain Modularity for community detection or PageRank—as a combination of Linear Algebra operations. For example, you can implement a BFS step as a Vector-Matrix Multiply over an adjacency matrix (without edge weights).
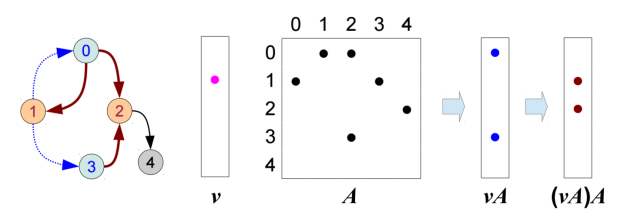

With DASL, you can implement algorithms for graph and big data analytics in terms of the underlying linear algebra for the algorithms, and they will be automatically translated into optimized GPU code. The primary abstractions of DASL are vectors and matrices, where the latter may be used to represent a graph by its adjacency matrix, its incidence matrix, or as an edge-weight matrix. You can specify these abstractions as generic types with a type parameter that captures the type of elements stored in a vector or matrix. To allow for an easy adoption of DASL by analytics experts, we have designed the language so that statements resemble linear algebra formulas. For instance, you can express the statement, given a matrix A and a vector v, using the following DASL statement.
var v2 = A <+>:<*> v
This statement initializes the variable v2 with the vector that is the result of the general matrix-vector multiplication of A and v, where the semiring used for this general operation can be an arbitrary semiring that is specified as the default for operations that involve A and v (which may be specified on a per-vector or a per-matrix basis). DASL provides built-in support for a number of typical semirings and basic functions over numeric data types and boolean values. You can also register additional semirings and functions. For instance, the following code snippet registers a unary function over integers and applies it element-wise over an integer vector v.
val myUnaryFct = daslContext.functionRegistry.registerUnaryFunction(
                     (x:Int) => if (x > 100) 100 else x )
val v2 = myUnaryFct.applyElementWise( v )
Blazegraph DASL is in testing now and will be launched at GTC this year. It provides integration with Apache Spark for accessing and managing data so you can easily move data to and from GPUs. We’ll be featuring DASL and the underlying implementation in our GTC 2016 talk.
Conclusion
The memory bandwidth advantages of GPUs provide a great way to accelerate data-intensive analytics and graph analytics in particular. Our work with graph query and iterative graph analytics has demonstrated significant speedups over CPU-based approaches. We’ve also focused strongly on making the speed of GPUs easily available by adopting existing graph standards and providing new ways to author iterative analytics within the Apache Spark ecosystem. I hope you’ve enjoyed this blog post. We’d love to hear from you, to get your thoughts on our work and hear about your experiences with GPUs for data-intensive analytics. If you’re interested, please see one of our talks at GTC 2016 this year or stop by our Booth #206.
In addition to the whole team at Blazegraph, we’d like to thank and recognize our collaborators in this work: Dr. Martin Berzins of the SCI Institute, Dr. Olaf Hartig of the Hasso Plattner Institute, and Dr. Michael Schmidt of Metaphacts, GmbH. We’d also like to thank Dr. Chris White (formerly at DARPA) and Mr. Frank Pound (DARPA) for their support in this research.
To learn even more about GPUs for data intensive analytics, come to the 2016 GPU Technology Conference (April 4-7 in San Jose, CA) and learn from the experts. Register now to save 20% with code “S7B2XS”!