

In the previous three posts of this CUDA Fortran series we laid the groundwork for the major thrust of the series: how to optimize CUDA Fortran code. In this and the following post we begin our discussion of code optimization with how to efficiently transfer data between the host and device. The peak bandwidth between the device memory and the GPU is much higher (144 GB/s on the NVIDIA Tesla C2050, for example) than the peak bandwidth between host memory and device memory (8 GB/s on the PCIe x16 Gen2). This disparity means that your implementation of data transfers between the host and GPU devices can make or break your overall application performance. Let’s start with a few general guidelines for host-device data transfers.
- Minimize the amount of data transferred between host and device when possible, even if that means running kernels on the GPU that get little or no speed-up compared to running them on the host CPU.
- Higher bandwidth is possible between the host and the device when using page-locked (or “pinned”) memory.
- Batching many small transfers into one larger transfer performs much better because it eliminates most of the per-transfer overhead.
- Data transfers between the host and device can sometimes be overlapped with kernel execution and other data transfers.
We investigate the first three guidelines above in this post, and we dedicate the next post to overlapping data transfers. First I want to talk about how to measure time spent in data transfers without modifying the source code.
Measuring Data Transfer Times with the Command-line Profiler
To measure the time spent in each data transfer, we could record a CUDA event before and after each transfer and use cudaEventElapsedTime(), as we described in a previous post. However, we can get the elapsed transfer time without instrumenting the source code with CUDA events by using the command-line CUDA profiler.
Enable the command-line profiler by setting the environment variable COMPUTE_PROFILE to 1 (here we set it using the Unix Bash shell).
% export COMPUTE_PROFILE=1
With the profiler enabled, when we execute any CUDA code (CUDA Fortran, CUDA C, or any other code that runs on the CUDA platform), the CUDA runtime records profiler output to a file (the default file is cuda_profile_0.log in the local directory, but you can configure this). Let’s look at the following code example.
program profile
  use cudafor
  implicit none
  integer, parameter :: N=1024
  real :: a(N,N)
  real, device :: a_d(N,N)

  a = 0
  a_d = a
  a = a_d
end program
When we execute this code the file cuda_profile_0.log is created in the current directory containing the following text.
# CUDA_PROFILE_LOG_VERSION 2.0
# CUDA_DEVICE 0 GeForce 8600M GT
# CUDA_CONTEXT 1
method,gputime,cputime,occupancy
method=[ memcpyHtoD ] gputime=[ 3720.288 ] cputime=[ 5576.532 ]
method=[ memcpyDtoH ] gputime=[ 2919.072 ] cputime=[ 3686.712 ]
The first three lines in the output are the header information. The fourth line lists the values that appear in the lines below it for each executed method. By default these are the method name being measured, the execution time in microseconds as recorded on the GPU, the time in microseconds as recorded by the CPU, and the occupancy, which is only reported for kernel execution (we will cover this in a later post).
Take care when interpreting the value reported by cputime. For non-blocking methods, such as kernels, the value reported by cputime is only the CPU overhead to launch the method, in which case the wall clock time is cputime + gputime. For blocking methods, such as these data transfers, cputime includes gputime and CPU overhead, so it is equivalent to wall clock time. In addition to launch overhead, the timing of the first called method also includes overhead associated with device initialization.
An alternative to the command-line profiler is the nvprof command-line application contained in the CUDA 5 Toolkit distribution. The command-line profiler and nvprof are mutually exclusive, so COMPUTE_PROFILE must be set to 0 when using nvprof. Aside from that caveat, using nvprof is a simple as running it with your CUDA app command as an argument, as shown in the output below. nvprof is quite flexible, so make sure you check out the documentation.
$ nvprof ./a.out
======== NVPROF is profiling a.out...
======== Command: a.out
======== Profiling result:
 Time(%)     Time  Calls      Avg      Min      Max  Name
   52.78   3.46ms      1   3.46ms   3.46ms   3.46ms  [CUDA memcpy HtoD]
   47.22   3.09ms      1   3.09ms   3.09ms   3.09ms  [CUDA memcpy DtoH]
Minimizing Data Transfers
We should not use only the GPU execution time of a kernel relative to the execution time of its CPU implementation to decide whether to run the GPU or CPU version. We also need to consider the cost of moving data across the PCI-e bus, especially when we are initially porting code to CUDA. Because CUDA’s heterogeneous programming model uses both the CPU and GPU, code can be ported to CUDA one subroutine at a time. In the initial stages of porting, data transfers may dominate the overall execution time. It’s worthwhile to keep tabs on time spent on data transfers separately from time spent in kernel execution. It’s easy to use the command-line profiler for this, as we already demonstrated. As we port more of our code, we’ll remove intermediate transfers and decrease the overall execution time correspondingly.
Pinned Host Memory
Host (CPU) data allocations are pageable by default. The GPU cannot access data directly from pageable host memory, so when a data transfer from pageable host memory to device memory is invoked, the CUDA driver must first allocate a temporary page-locked, or “pinned”, host array, copy the host data to the pinned array, and then transfer the data from the pinned array to device memory, as illustrated below.
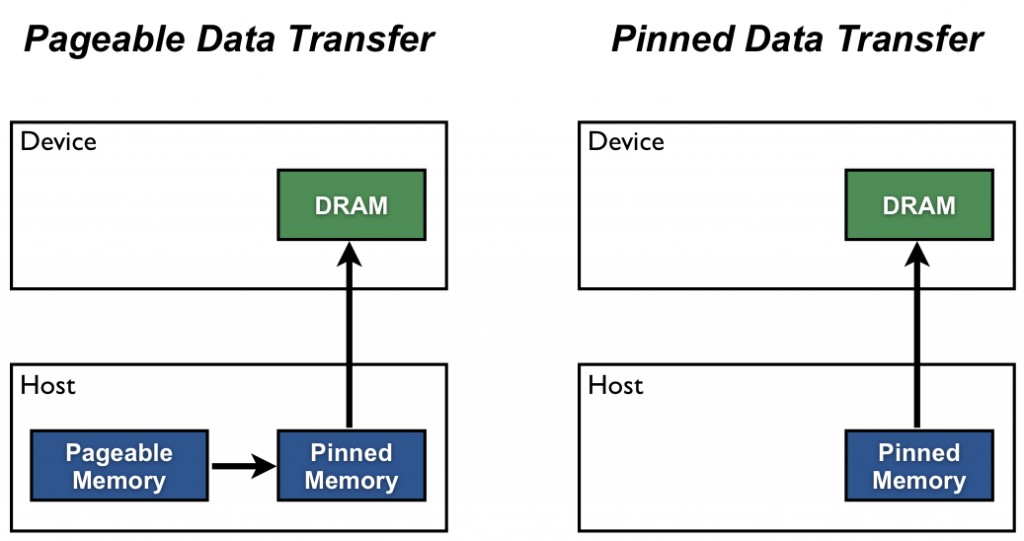
As you can see in the figure, pinned memory is used as a staging area for transfers from the device to the host. We can avoid the cost of the transfer between pageable and pinned host arrays by directly allocating our host arrays in pinned memory. In CUDA Fortran, denote pinned memory using the pinned variable attribute. Pinned memory declarations must also be allocatable. It is possible for the allocate statement to fail to allocate pinned memory, in which case it will attempt a pageable memory allocation. The following code excerpt demonstrates the declaration and allocation of pinned memory with error checking.
real, allocatable, pinned :: array(:)
logical :: pinnedFlag
integer :: istat

allocate(array(N), STAT=istat, PINNED=pinnedFlag)
if (istat /= 0) then
  write(*,*) 'Allocation of array failed'
  call handleAllocationFailure(istat)
else
  if (.not. pinnedFlag) write(*,*) &
    'Pinned allocation of array failed - using pageable memory'
end if
This example performs pinned memory allocation with the optional keyword arguments for STAT and PINNED, and then checks to see if the allocation succeeded, and if so whether the resulting allocation is pinned. Data transfers using host pinned memory use the same syntax as transfers with pageable memory. We can use the following code to compare pageable and pinned transfer rates.
program BandwidthTest

  use cudafor
  implicit none

  integer, parameter :: nElements = 4*1024*1024

  ! host arrays
  real :: a_pageable(nElements), b_pageable(nElements)
  real, allocatable, pinned :: a_pinned(:), b_pinned(:)

  ! device arrays
  real, device :: a_d(nElements)

  ! events for timing
  type (cudaEvent) :: startEvent, stopEvent

  ! misc
  type (cudaDeviceProp) :: prop
  real :: time
  integer :: istat, i
  logical :: pinnedFlag

  ! allocate and initialize
  do i = 1, nElements
    a_pageable(i) = i
  end do
  b_pageable = 0.0

  allocate(a_pinned(nElements), b_pinned(nElements), &
           STAT=istat, PINNED=pinnedFlag)
  if (istat /= 0) then
    write(*,*) 'Allocation of a_pinned/b_pinned failed'
    pinnedFlag = .false.
  else
    if (.not. pinnedFlag) write(*,*) 'Pinned allocation failed'
  end if

  if (pinnedFlag) then
    a_pinned = a_pageable
    b_pinned = 0.0
  endif

  istat = cudaEventCreate(startEvent)
  istat = cudaEventCreate(stopEvent)

  ! output device info and transfer size
  istat = cudaGetDeviceProperties(prop, 0)

  write(*,*)
  write(*,*) 'Device: ', trim(prop%name)
  write(*,*) 'Transfer size (MB): ', 4*nElements/1024./1024.

  ! pageable data transfers
  write(*,*)
  write(*,*) 'Pageable transfers'

  istat = cudaEventRecord(startEvent, 0)
  a_d = a_pageable
  istat = cudaEventRecord(stopEvent, 0)
  istat = cudaEventSynchronize(stopEvent)

  istat = cudaEventElapsedTime(time, startEvent, stopEvent)
  write(*,*) '  Host to Device bandwidth (GB/s): ', &
    nElements*4*1e-6/time

  istat = cudaEventRecord(startEvent, 0)
  b_pageable = a_d
  istat = cudaEventRecord(stopEvent, 0)
  istat = cudaEventSynchronize(stopEvent)

  istat = cudaEventElapsedTime(time, startEvent, stopEvent)
  write(*,*) '  Device to Host bandwidth (GB/s): ', &
    nElements*4*1e-6/time

  if (any(a_pageable /= b_pageable)) &
    write(*,*) '*** Pageable transfers failed ***'

  ! pinned data transfers
  if (pinnedFlag) then
    write(*,*)
    write(*,*) 'Pinned transfers'

    istat = cudaEventRecord(startEvent, 0)
    a_d = a_pinned
    istat = cudaEventRecord(stopEvent, 0)
    istat = cudaEventSynchronize(stopEvent)

    istat = cudaEventElapsedTime(time, startEvent, stopEvent)
    write(*,*) '  Host to Device bandwidth (GB/s): ', &
      nElements*4*1e-6/time

    istat = cudaEventRecord(startEvent, 0)
    b_pinned = a_d
    istat = cudaEventRecord(stopEvent, 0)
    istat = cudaEventSynchronize(stopEvent)

    istat = cudaEventElapsedTime(time, startEvent, stopEvent)
    write(*,*) '  Device to Host bandwidth (GB/s): ', &
      nElements*4*1e-6/time

    if (any(a_pinned /= b_pinned)) &
      write(*,*) '*** Pinned transfers failed ***'
  end if

  write(*,*)

  ! cleanup
  if (allocated(a_pinned)) deallocate(a_pinned)
  if (allocated(b_pinned)) deallocate(b_pinned)
  istat = cudaEventDestroy(startEvent)
  istat = cudaEventDestroy(stopEvent)

end program BandwidthTest
The data transfer rate can depend on the type of host system (motherboard, CPU, and chipset) as well as the GPU. On a Harpertown CPU system with an NVIDIA Tesla C2050 GPU, running BandwidthTest produces the following results. As you can see, pinned transfers are much faster.
Device: Tesla C2050
Transfer size (MB): 16.00000

Pageable transfers
  Host to Device bandwidth (GB/s): 1.585274
  Device to Host bandwidth (GB/s): 1.661195

Pinned transfers
  Host to Device bandwidth (GB/s): 5.693893
  Device to Host bandwidth (GB/s): 6.370604
On a Nehalem CPU system with a Tesla M2050 GPU (equivalent to a C2050), we get better pageable transfer performance, as the following output shows. This is presumably because the faster Nehalem CPU reduces the host-side memory copy cost.
Device: Tesla M2050
Transfer size (MB): 16.00000

Pageable transfers
  Host to Device bandwidth (GB/s): 3.428861
  Device to Host bandwidth (GB/s): 3.723064

Pinned transfers
  Host to Device bandwidth (GB/s): 5.965163
  Device to Host bandwidth (GB/s): 6.314567
You should not over-allocate pinned memory. Doing so can reduce overall system performance because it reduces the amount of physical memory available to the operating system and other programs. How much is too much is difficult to tell in advance, so as with all optimizations, test your applications and the systems they run on for optimal performance parameters.
Batching Small Transfers
Due to the overhead associated with each transfer, it is preferable to batch many small transfers together into a single transfer. This is easy to do by using a temporary array, preferably pinned, and packing it with the data to be transferred.
When transferring data via assignment statements, multiple actual transfers may result from a single assignment statement. The chance of this happening has been greatly reduced with recent compiler versions, but it may still occur. (You can see the number of actual transfers that result from an assignment statement using the command-line profiler.) To make sure only a single transfer is performed, use the cudaMemcpy() function, which has the following syntax.
istat = cudaMemcpy(destination, source, nElements)
The arguments of cudaMemcpy() are the destination array, source array, and the number of elements to transfer. Because CUDA Fortran is strongly typed, there is no need to specify transfer direction as in CUDA C/C++. The compiler is able to detect where the data in the first two arguments reside based on whether they were declared with the device attribute, and generates the appropriate data transfer calls.
You can also use assignment notation for sub-array transfers.
a_d(2:5, 3:8) = a(2:5, 3:8)
Alternatively, you can use cudaMemcpy2D(). The following code shows how to perform the same copy as in the assignment notation above, assuming the arrays are of dimension (n,n).
istat = cudaMemcpy2D(a_d(2,3), n, a(2,3), n, 5-2+1, 8-3+1)
The arguments here are the first destination element and the pitch of the destination array, the first source element and pitch of the source array, and the width and height of the submatrix to transfer. There is also a cudaMemcpy3D() function for transfers of rank three array sections.
Summary
Transfers between the host and device are the slowest link of data movement involved in GPU computing, so you should take care to minimize transfers. Following the guidelines in this post can help you make sure necessary transfers are efficient. When you are porting or writing new CUDA Fortran code, I recommend that you start by using transfers via assignment statements on pageable memory. As I mentioned earlier, as you write more device code you will eliminate some of the intermediate transfers, so any effort you spend optimizing transfers early in porting may be wasted. Also, rather than instrument code with CUDA events or other timers to measure time spent for each transfer, I recommend that you use the command-line profiler or nvprof.
This post focused on making data transfers efficient. In the next post, we discuss how you can overlap data transfers with computation and with other data transfers.