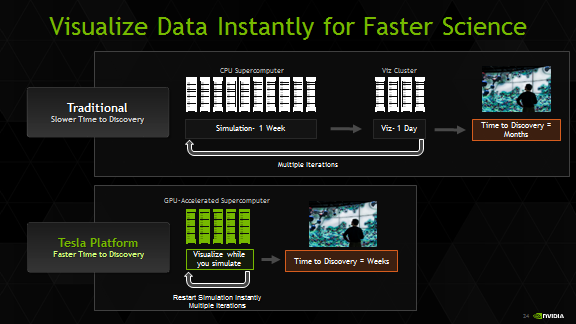
So, you just got access to the latest supercomputer with thousands of GPUs. Obviously this is going to help you a lot with accelerating your scientific calculations, but how are you going to analyze, reduce and visualize this data? Historically, you would be forced to write everything out to disk, just to later read it back into another data analysis cluster.
Wouldn’t it be nice if you could analyze and visualize your data as it is being generated, without having to go through a file system? And wouldn’t it be cool to interact with the simulation, maybe even modifying parameters while the simulation is running?
And wouldn’t it be nice to use your GPU for that as well? As it turns out, you can actually do this. It’s called in-situ visualization, meaning visualization of datasets in-place where they are computed. High-quality, high performance rendering and visualization is just one of the capabilities of the Tesla Accelerated Computing Platform. Depending on the site where you’re running, it just takes a couple of steps to get your system configured correctly, and in this post I’ll tell you how.
But before walking you through the steps necessary to get your system set up to enable remote, in-situ visualizations, I’ll describe a few use cases for in-situ visualization, and show you some of the tools that can help you to add visualization capability into your application.
Insight with In-Situ
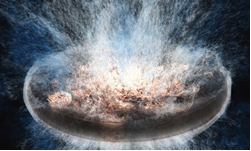
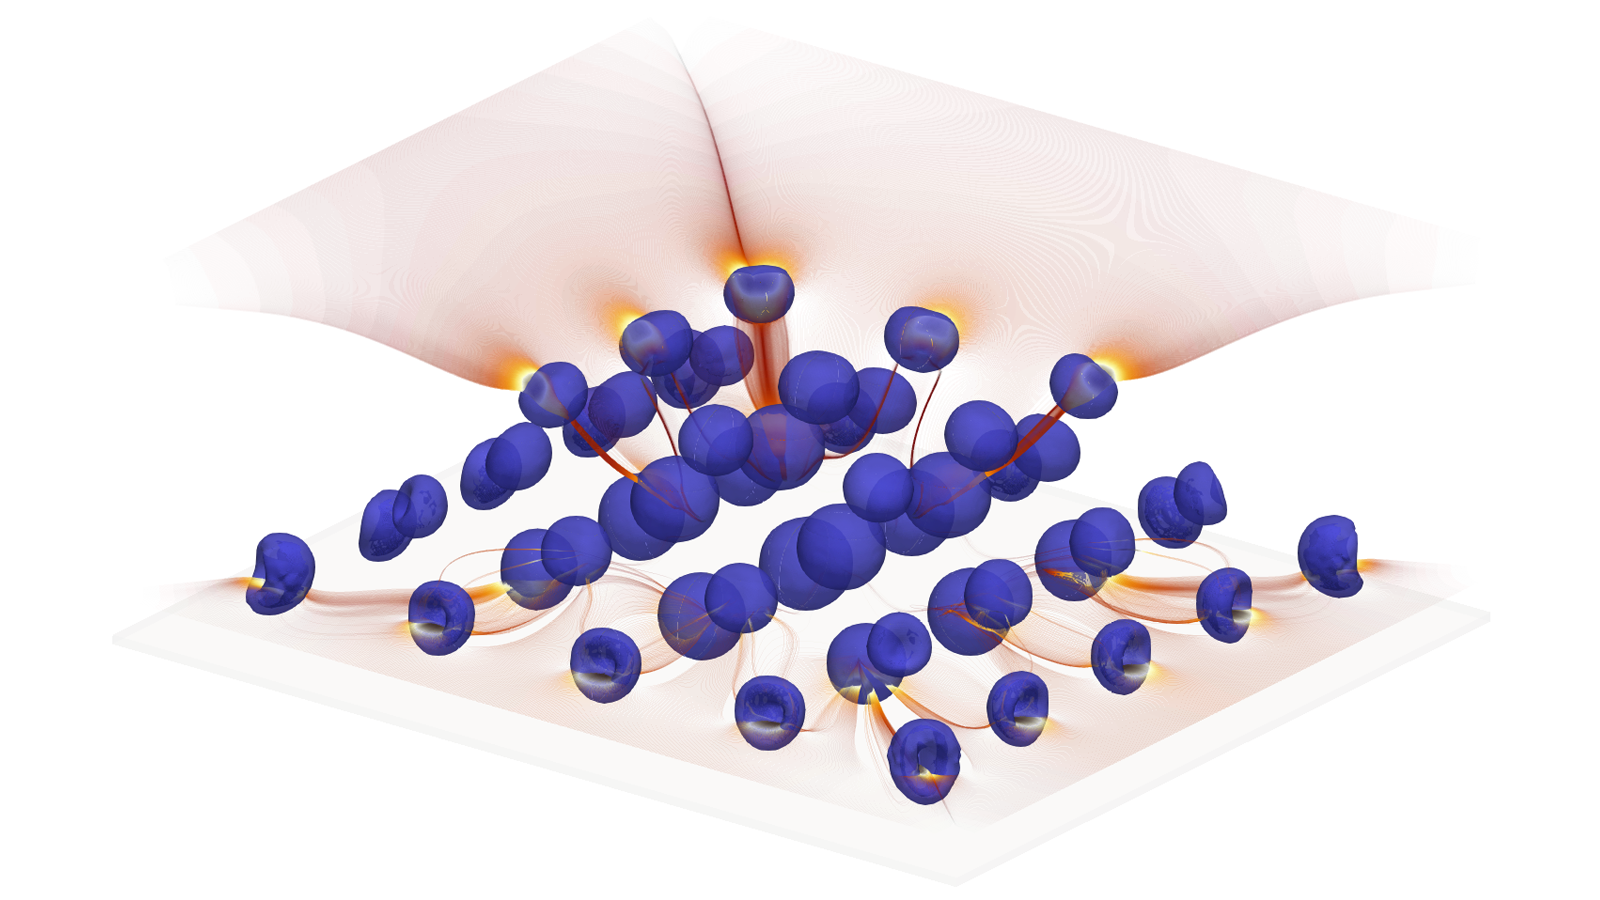
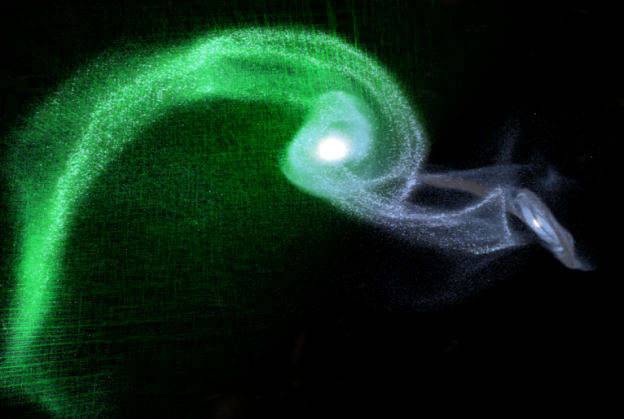
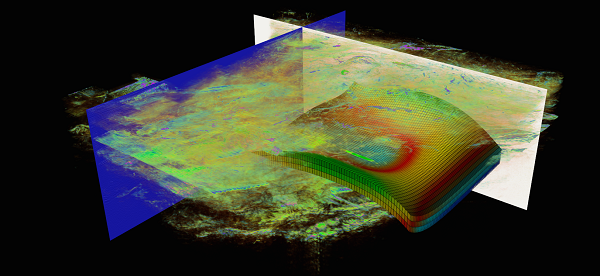
Cosmological simulations like those undertaken by a group led by Professor Simon Portegies-Zwart at the Leiden Observatory in the Netherlands provide a good example of present-day in-situ visualization. To understand how the Milky Way galaxy formed, and how dark matter influenced the process, they run very large-scale GPU-accelerated gravitational simulations with the Bonsai2 code. Their simulations are so powerful and efficient, that their code is one of the nominees for this year’s Gordon Bell awards.
Historically, visualizing and analyzing these simulations required writing snapshots of the simulation data to disk every few time-steps, but this cost a lot of disk space and required a lot of time for post-processing and analyzing the data.
More recently, Dr. Evghenii Gaburov and Dr. Jeroen Bédorf (now at SURFsara and Centrum Wiskunde & Informatica, respectively), have extended the Bonsai code with in-situ capabilities that allow the astrophysicists to visualize their data while the simulation is running (Figure 1). Seeing how the simulation evolves in real time and being able to dive into the virtual world allows the scientists to get a better understanding of the dynamical processes involved in these cosmological phenomena. It also helps to enhance the scientist’s productivity, for example by spotting poor simulation setups early or to quickly detect reaching a steady state. Particularly exciting is the potential for “accidental” discoveries, phenomena that were not expected to be found when the simulation was originally set up. Come visit the NVIDIA booth at Supercomputing 2014 to see a galaxy simulation with a stunning in-situ visualization running on 128 nodes of the CSCS Piz Daint supercomputer.
In-situ visualization can be taken a step further by allowing users to adjust simulation parameters and steer the simulation. You can think of this as the HPC equivalent of a spreadsheet: In the same way a spreadsheet with many interconnected cells reacts to adjustments and immediately re-calculates all results, you can allow a complex simulation to react to user input while the simulation is under way. This enables a broad range of new applications and allows scientists and engineers to gain an intuitive understanding of highly complex systems through playful interaction.
Take, for example, an engineer studying an airfoil: instead of running a batch of simulations and comparing the results in a post-processing step, in-situ visualization and application steering allow the engineer to modify the simulation while it is performed, seeing the immediate impact of these changes on the physics. This provides a much better insight into the relationship between the shape of the airfoil and the resulting turbulence.
Tools for Visualization
So what does it take to analyze and visualize your simulation data in situ? Will you need to write an entire visualization tool suite from scratch? Luckily, this is often not necessary.
Because it is such a central piece of computational science (what is running simulations if you can’t analyze and visualize the results?), a broad range of commercial and open-source visualization and analysis tools have been developed over the past two decades, ranging from spreadsheet-like tools, to analysis suites with embedded scripting, all the way to tools with visual programming capabilities. Many of these tools were developed for specific application domains or markets, such as fluid dynamics, geospatial data, or medical imaging.
Over the past decade, two tools have garnered a lot of attention, especially for massively parallel environments: ParaView and VisIt. Largely funded by the US Government, these two tools are distributed under an open source license, enabling scientists around the world to take advantage of their powerful visualization and analysis capabilities.
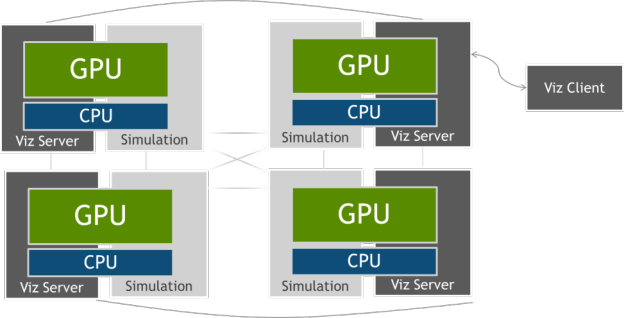
ParaView and Visit are both designed from the ground up for massively parallel, remote visualization as typically encountered in HPC. They tackle data sets so huge that they need to be distributed across multiple nodes of a supercomputer, and all the visualization steps, including filtering, rendering and compositing can take advantage of multiple processors. Their client-server architecture allows for remote visualization, providing a responsive user interface without requiring transfers of large datasets from the supercomputing facility.
As you can imagine, there are many challenges involved in developing massively parallel visualization tools. One of them is merging together the final frame from partial frames rendered by the different nodes. For this step, both ParaView and VisIt use IceT, a powerful parallel compositing library developed at Sandia National Laboratory, enabling them to scale rendering to as many nodes as available in the system.
How do GPUs fit into this picture? Commonly, one associates the Tesla GPUs encountered in supercomputers with compute acceleration via CUDA or OpenACC, and Quadro or GeForce GPUs with rendering tasks using OpenGL. But Tesla GPUs offer all the high-end graphics capabilities you would expect from Quadro and GeForce. That means your GPU-accelerated supercomputer can act as a very high-performance visualization and analysis system, giving you the flexibility of scaling visualization resources with your compute resources.
Paraview and VisIt can take advantage of OpenGL via the Visualization Toolkit VTK, significantly accelerating rendering performance using the GPUs in your supercomputer. With the latest version of VTK, rendering performance has seen a tremendous performance boost from GPUs.
Paths To In-Situ
Knowing that the Tesla GPUs on your compute nodes can be used for both compute and rendering, in-situ visualization is a natural next step. There is no need to write anything out to disk, and in many cases it’s not even necessary to ship your data to another processor. All data can remain distributed on the nodes for compute and rendering, leveraging the power of the Tesla GPUs for both compute and visualization.
In order to use ParaView for in-situ visualization, you use a tool called Catalyst. Catalyst is basically a reduced version of the ParaView server component linked into your application, allowing your application to share data with ParaView for visualization. The details are beyond the scope of this blog, but have a look at the ParaView wiki. Using a tool called Piston from Los Alamos National Laboratory, it’s then even possible to share data on the GPU between simulation and visualization, avoiding costly data copies.
Similar capabilities are available within VisIt with the libsim library. This library enables you to link the VisIt server component into your application, enabling data sharing between the application and the vis system. libsim also enables the opposite flow of information, sending data form the client to the simulation, enabling application steering.
High-Performance Volume Visualization and Ray Tracing
So far we have concentrated on VisIt and ParaView, but as mentioned above, there is a broad range of visualization applications, all with their own particular strengths. Many scientists need to visualize large amounts of volume data produced in simulations superimposed on geometry data for meaningful interpretation of the combined scene. NVIDIA IndeX is a commercial software solution that which leverages GPU clusters for real-time scalable visualization and computing of multi-valued volumetric data together with embedded geometry. IndeX supports in-situ visualization and remoting capabilities on large displays.
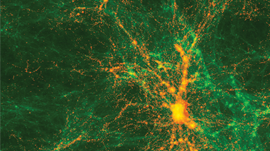
In many cases, scientific visualization can benefit from the photorealistic rendering techniques traditionally employed by the film industry. Adding lighting effects such as reflection, refraction, and soft shadows using ray tracing reveals details that can’t be seen otherwise, providing scientists with enhanced insight into physical phenomena. Not to mention that it makes spectacularly beautiful images.
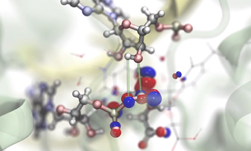
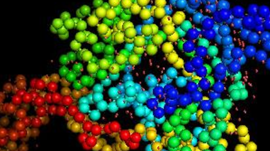
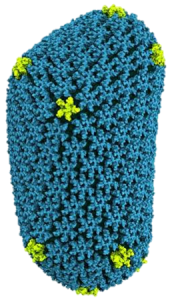
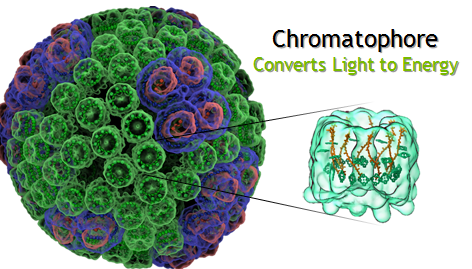
The NVIDIA OptiX™ ray tracing engine brings this enhanced insight and interactive realism to applications by greatly increasing ray tracing speeds on Tesla GPUs using CUDA. OptiX ray tracing helped scientists at the University of Illinois, Urbana-Champaign to visualize and analyze the world’s first complete atomic-level model of the chemical structure of the HIV capsid with 4.2 million atoms in VMD, a widely-used molecular visualization program (see Figure 1). It also helped them to visualize the first complete structure of the light harvesting bacteria chromatophore with 100 million atoms in VMD (See Figure 6). To experience what ray tracing brings to the scientific community, please visit the NVIDIA booth at SC’14 for a live and interactive demonstration of the HIV Capsid and Chromatophore.
Unleashing the Graphics Power of Your Tesla GPUs
I hope I have convinced you that the combination of compute and visualization capabilities of GPUs in your leading edge supercomputer offer exciting paths to make large scale simulations more interactive. But in order to unleash the powerful graphics capabilities in your supercomputer’s GPUs, there are two things that need to be set up on your system: your GPUs need to have their OpenGL capabilities enabled, and you need to run an X server on your system.
By default, Tesla K10, K20 and K20X GPUs are shipped with their OpenGL capabilities disabled. In order to turn them on, you need to set their Graphics Operations Mode (GOM) from “compute” to “all on” using the nvidia-smi utility.
nvidia-smi –i 1 –gom 0
This command sets GPU device 1 to graphics operation mode “all on”. You can also query the status of the graphics capabilities with the following command.
nvidia-smi --format=csv --query-gpu=gom.current
Note that on newer generation GPUs, including Tesla K40 and K80, the graphics capabilities are enabled by default and the GOM does not need to be set explicitly.
In order to take advantage of the GPU for rendering, you will also need an X server running on the node, managing the OpenGL context of the GPU. On most Linux distributions, setting up an X server is straightforward and can be accomplished with the standard package management tools. On more exotic systems it might be necessary to build the X server manually. If you need help with such a system, please get in touch with us at hpcviz@nvidia.com.
Once you have the GPUs correctly configured and you have an X server up and running, you will be able to use the GPUs both for compute and rendering.
SimpleGL is Remotely Simple
As a proxy for a visualization application, let’s have a look at the simplest graphics example in the CUDA SDK, SimpleGL. SimpleGL creates a point mesh, modifies the positions of the points in CUDA and displays the result on screen.
Now, with the GPU set to GOM=”all on” and with a correctly configured X server you will be able to run the demo. However, you won’t be able to see anything on your screen, because the demo displays the output on the remote X server.
In the case of professional visualization tools like VisIt or ParaView, this is not a problem since these tools implement their own mechanism for delivering frames to the user’s desktop. But in a conventional OpenGL application originally developed for desktop use and without any special client-server architecture, an additional step needs to be taken in order to transport the frames to the end user. A range of remote OpenGL tools exist, including VirtualGL/TurboVNC or NICE DCV.
The advantage of VirtualGL/TurboVNC is its wide availability and the fact that it is free software. At the moment, however, it only supports software compression of the resulting frames via the turbojpeg library. This is one of the strengths of NICE DCV, which can take advantage of the hardware H.264 video-stream encoder available on Kepler-class GPUs via the NVENC library.
With these steps, you are ready to get started using the GPUs on a remote system for in-situ visualization, application steering or OpenGL-based visualization in general. We expect that the combination of massively parallel GPU performance and high-fidelity analysis and visualization will enable a broad range of novel large-scale interactive applications. We look forward to hearing your stories about the important scientific challenges that these powerful tools help you solve.