Resource management software, such as SLURM, PBS, and Grid Engine, manages access for multiple users to shared computational resources. The basic unit of resource allocation is the “job”, a set of resources allocated to a particular user for a period of time to run a particular task.

Job level GPU usage and accounting enables both users and system administrators to understand system resources being used by a particular job or jobs.
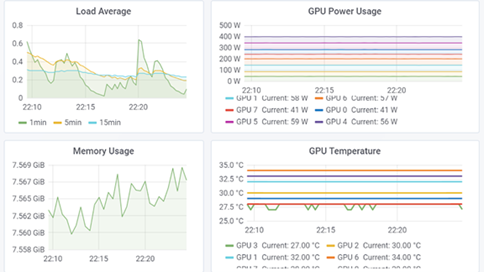
NVIDIA Data Center GPU Manager (DCGM) offers a comprehensive tool suite that simplifies administration and monitoring of NVIDIA Tesla-accelerated data centers. A previous post described how to setup GPU telemetry with DCGM. Unlike telemetry, which is continuously collected and unaware of the resource manager or job boundaries, job statistics need to be integrated with the resource manager and associated with the job start and stop boundaries.
This article describes how to integrate DCGM job statistics with SLURM and make this information available to users. The same general workflow may also be used with other resource management software. We assume that the compute nodes have DCGM installed and the DCGM host engine service is running. Please refer to the previous article if you need to install and configure DCGM.
Setting a GPU Group
First, create a DCGM group for the set of GPUs to include in the statistics. In most cases, statistics should be collected on all the GPUs in the system. Since all the GPUs will be included in the group, let’s name the group “allgpus”.
$ dcgmi group -c allgpus --default
Successfully created group "allgpus" with a group ID of 2
Note that the group ID depends on what other groups have been previously created and will vary.
You can confirm that the GPU group includes all the GPUs.
$ dcgmi group -g 2 -i
+-------------------+----------------------------------------------------------+
| GROUP INFO                                                                   |
+===================+==========================================================+
| 2                 |                                                          |
| -> Group ID       | 2                                                        |
| -> Group Name     | allgpus                                                  |
| -> Entities       | GPU 0, GPU 1, GPU 2, GPU 3, GPU 4, GPU 5, GPU 6, GPU 7   |
+-------------------+----------------------------------------------------------+
Collecting Job Statistics
The DCGM host engine service continuously runs in the background and must be notified of job start and stop boundaries. Therefore, for each job, we:
- Start recording job statistics labelled with a job unique identifier such as the job ID at the beginning of the job
- Run the workload, and
- Stop recording job statistics and generate the job report at the end of the job
Start Collecting Job Statistics
Before running the GPU accelerated task, DCGM job statistics must be enabled (-e) for the GPU group created in the previous step (recall the group ID was 2) .
$ dcgmi stats -g 2 -e
Successfully started process watches.
Next, start recording job statistics (-s) for the previously created GPU group. The label is the unique SLURM job ID, 60825 in this case. This assumes that the session was allocated by SLURM; if not, then the $SLURM_JOBID environment variable will be empty and another unique identifier should be used.
$ dcgmi stats -g 2 -s $SLURM_JOBID
Successfully started recording stats for 60825.
Note that the job statistics recording starts with this command, not when the user workload starts. If a significant gap between the two exists, some extra unrepresentative time will be included in the job statistics report.
Run the user workload
The user’s workload runs at this point. Note that the user’s workload requires no modification.
Stop Collecting Job Statistics
After the user’s workload has completed, stop the recording (-x).
$ dcgmi stats -x $SLURM_JOBID
Successfully stopped recording stats for 60825.
The job statistics continue to be collected until you run this command, not when the user workload ends. If a significant gap lies between the two, some extra unrepresentative time may be included in the job statistics report.
Generate a Job Statistics Report
After stopping the recording, generate a summary job statistics report (-j) aggregated over all the included GPUs.
$ dcgmi stats -j $SLURM_JOB
Successfully retrieved statistics for job: 60825.
+------------------------------------------------------------------------------+
| Summary                                                                      |
+====================================+=========================================+
|-----  Execution Stats  ------------+-----------------------------------------|
| Start Time                         | Tue Apr  9 20:55:39 2019                |
| End Time                           | Tue Apr  9 21:44:38 2019                |
| Total Execution Time (sec)         | 2938.68                                 |
| No. of Processes                   | 8                                       |
+-----  Performance Stats  ----------+-----------------------------------------+
| Energy Consumed (Joules)           | 4088486                                 |
| Power Usage (Watts)                | Avg: 1380.84, Max: N/A, Min: N/A        |
| Max GPU Memory Used (bytes)        | 16467886080                             |
| Clocks and PCIe Performance        | Available per GPU in verbose mode       |
+-----  Event Stats  ----------------+-----------------------------------------+
| Single Bit ECC Errors              | 0                                       |
| Double Bit ECC Errors              | 0                                       |
| PCIe Replay Warnings               | Not Specified                           |
| Critical XID Errors                | 0                                       |
+-----  Slowdown Stats  -------------+-----------------------------------------+
| Due to - Power (%)                 | 0                                       |
|        - Thermal (%)               | 0                                       |
|        - Reliability (%)           | Not Supported                           |
|        - Board Limit (%)           | Not Supported                           |
|        - Low Utilization (%)       | Not Supported                           |
|        - Sync Boost (%)            | 0                                       |
+-----  Overall Health  -------------+-----------------------------------------+
| Overall Health                     | Healthy                                 |
+------------------------------------+-----------------------------------------+
The summary report shows basic information about the job, including how long it ran and GPU performance information, such as the amount of energy used. The report also indicates if any GPU related issues occurred during the job, such as double bit ECC errors or if the job was throttled due to temperature constraints.
You can also generate a more detailed report (-v), with the data broken down per GPU. This example shows only the first of the 8 GPUs.
$ dcgmi stats -v -j $SLURM_JOBID
Successfully retrieved statistics for job: 60825.
+------------------------------------------------------------------------------+
| GPU ID: 0                                                                    |
+====================================+=========================================+
|-----  Execution Stats  ------------+-----------------------------------------|
| Start Time                         | Tue Apr  9 20:55:39 2019                |
| End Time                           | Tue Apr  9 21:44:38 2019                |
| Total Execution Time (sec)         | 2938.68                                 |
| No. of Processes                   | 1                                       |
+-----  Performance Stats  ----------+-----------------------------------------+
| Energy Consumed (Joules)           | 500131                                  |
| Power Usage (Watts)                | Avg: 170.726, Max: 328.514, Min: 41.621 |
| Max GPU Memory Used (bytes)        | 16467886080                             |
| SM Clock (MHz)                     | Avg: 1389, Max: 1530, Min: 135          |
| Memory Clock (MHz)                 | Avg: 877, Max: 877, Min: 877            |
| SM Utilization (%)                 | Avg: 59, Max: 99, Min: 0                |
| Memory Utilization (%)             | Avg: 52, Max: 88, Min: 0                |
| PCIe Rx Bandwidth (megabytes)      | Avg: 1084, Max: 2147, Min: 0            |
| PCIe Tx Bandwidth (megabytes)      | Avg: 1488, Max: 1741, Min: 1269         |
+-----  Event Stats  ----------------+-----------------------------------------+
| Single Bit ECC Errors              | 0                                       |
| Double Bit ECC Errors              | 0                                       |
| PCIe Replay Warnings               | 0                                       |
| Critical XID Errors                | 0                                       |
+-----  Slowdown Stats  -------------+-----------------------------------------+
| Due to - Power (%)                 | 0                                       |
|        - Thermal (%)               | 0                                       |
|        - Reliability (%)           | Not Supported                           |
|        - Board Limit (%)           | Not Supported                           |
|        - Low Utilization (%)       | Not Supported                           |
|        - Sync Boost (%)            | 0                                       |
+--  Compute Process Utilization  ---+-----------------------------------------+
| PID                                | 59363                                   |
|     Avg SM Utilization (%)         | 58                                      |
|     Avg Memory Utilization (%)     | 51                                      |
+-----  Overall Health  -------------+-----------------------------------------+
| Overall Health                     | Healthy                                 |
+------------------------------------+-----------------------------------------+
...
The detailed report includes useful information such as the average, maximum, and minimum GPU utilization, clock frequencies, and data movement statistics.
SLURM Integration
The DCGM job statistics workflow aligns very well with the typical resource manager prolog and epilog script configuration. The steps to set up the GPU group, enable statistics, and start the recording should be added to the SLURM prolog script. The steps to stop the recording and generate the job report should be added to the SLURM epilog script.
SLURM Prolog:
# DCGM job statistics
group=$(sudo -u $SLURM_JOB_USER dcgmi group -c allgpus --default)
if [ $? -eq 0 ]; then
  groupid=$(echo $group | awk '{print $10}')
  sudo -u $SLURM_JOB_USER dcgmi stats -g $groupid -e
  sudo -u $SLURM_JOB_USER dcgmi stats -g $groupid -s $SLURM_JOBID
fi
SLURM Epilog:
# DCGM job statistics
OUTPUTDIR=$(scontrol show job $SLURM_JOBID | grep WorkDir | cut -d = -f 2)
sudo -u $SLURM_JOB_USER dcgmi stats -x $SLURM_JOBID
sudo -u $SLURM_JOB_USER dcgmi stats -v -j $SLURM_JOBID | \
    sudo -u $SLURM_JOB_USER tee $OUTPUTDIR/dcgm-gpu-stats-$HOSTNAME-$SLURM_JOBID.out
The epilog script writes the detailed job statistics report to the working directory of the job. The report could also be written to a system directory for post-processing and aggregation across the entire system.
Summary
Integrating DCGM with SLURM provides administrators and users with valuable information about GPU usage at the job level. The data provides basic job accounting information as well as insight on how well user jobs are using GPUs and if any hardware errors meritting further investigation occurred during the job’s lifetime.
Job statistics and GPU telemetry are just two of the features of DCGM. DCGM also includes active health checks, diagnostics, as well as policy and configuration management capabilities.