Today’s data centers demand greater agility, resource uptime and streamlined administration to deal with the ever-increasing computational requirements of HPC, hyperscale and enterprise workloads. IT administrators depend on robust data center management tools to proactively monitor resource health, increase efficiency and lower operational costs.

In this blog post, I’ll tell you about a new tool suite designed to address the key infrastructure challenges of GPU-accelerated data centers. NVIDIA Data Center GPU Manager (DCGM) simplifies GPU administration in the data center, improves resource reliability and uptime, automates administrative tasks, and helps drive overall infrastructure efficiency. DCGM is an intelligent, low overhead tool suite that performs a variety of functions on each host system including active health monitoring, diagnostics, system validation, policies, power and clock management, group configuration and accounting.
The focus of the toolsuite is to make GPU management simpler for system administrators. DCGM is available as a standalone tool suite and will also be integrated with leading cluster management and job scheduling solutions such as Bright Cluster Manager, Altair PBS Works and IBM Spectrum LSF. DCGM is also an integral component of the NVIDIA DGX-1 Deep Learning System. In this post I’ll illustrate the use of a few key features of DCGM both as a standalone tool as well as with an integrated ISV cluster management/job scheduling solution.
Active Health Monitoring
Monitoring the health of a GPU and its interaction with the surrounding system is critical for IT administrators, so it’s important for a management tool to provide extensive diagnostic capabilities with minimal overhead on the system or effects on application performance. Today’s monitoring tools gather overwhelming amounts of diagnostic data that IT admins often struggle to make sense of, lacking the necessary guidance to take appropriate actions. This results in unexpected failures and resource downtimes, which not only add overhead for admins but also affect the overall productivity of data centers.
DCGM helps by providing timely identification and resolution of GPU issues through robust, active health monitoring and diagnostics. DCGM includes multiple levels of health monitoring that can be initiated as part of the job life cycle or independently as needed.
- Run-time health checks: Low-overhead, non-invasive health monitoring can be initiated while jobs are running and queried at any time, without impact to application behavior and performance.
- Prologue check: Quick health check of the GPU (which takes a few seconds) before scheduling a job to ensure overall health and readiness.
- Epilogue check: online GPU diagnostic tests to determine root cause issues, initiated upon job failures. These take a few minutes to complete.
The following output from DCGM shows examples of non-invasive run-time health checks. In the top example the dcgmi tool shows an aggregate indicator of overall health; in this case the GPU is healthy. The bottom example shows a report of one GPU with an InfoROM issue and one with a PCIe issue.
dcgmi health --check -g 1
Health Monitor Report
+------------------+---------------------------------------------------------+
| Overall Health:   Healthy                                                  |
+==================+=========================================================+

dcgmi health --check -g 1
Health Monitor Report
+----------------------------------------------------------------------+
| Group 1       | Overall Health: Warning                              |
+==================+===================================================+
| GPU ID: 0     | Warning                                              |
|               | PCIe system: Warning - Detected more than 8 PCIe     |
|               | replays per minute for GPU 0: 13                     |
+---------------+------------------------------------------------------+
| GPU ID: 1     | Warning                                              |
|               | InfoROM system: Warning - A corrupt InfoROM has been |
|               | detected in GPU 1.                                   |
+---------------+------------------------------------------------------+
Diagnostics and System Validation
Often in a GPU-dense cluster, one of the challenges admins face is the lack of tools to effectively identify failures, performance degradations, power inefficiencies and their root causes. Today, if a GPU fails in a node, admins need to spend time manually tracing and detecting the failed device, and running offline diagnostic tests. This requires taking the node completely down, removing system software and installing a special driver for performing deep diagnostics.
DCGM includes a system validation feature that performs deep diagnostics to actively investigate hardware problems or serious system issues. Deep diagnostics include validating GPU compute performance, interconnect bandwidth and latency, power and thermal characteristics, and detecting any violations or anomalies. The following output shows an example of a thorough diagnostic report from DCGM.
dcgmi diag -r 3
+---------------------------+-------------+
| Diagnostic                | Result      |
+===========================+=============+
|-----  Deployment  --------+-------------|
| Blacklist                 | Pass        |
| NVML Library              | Pass        |
| CUDA Main Library         | Pass        |
| CUDA Toolkit Libraries    | Pass        |
| Permissions and OS Blocks | Pass        |
| Persistence Mode          | Pass        |
| Environment Variables     | Pass        |
| Page Retirement           | Pass        |
| Graphics Processes        | Pass        |
+-----  Hardware  ----------+-------------+
| GPU Memory                | Pass - All  |
| Diagnostic                | Pass - All  |
+-----  Integration  -------+-------------+
| PCIe                      | Pass - All  |
+-----  Performance  -------+-------------+
| SM Performance            | Pass - All  |
| Targeted Performance      | Pass - All  |
| Targeted Power            | Warn - All  |
+---------------------------+-------------+
DCGM stores test logs on the host file system. System validation and stress checks provide additional time series data via JSON text files for more detailed information about GPU behavior during each test.
Policy Management
At data center scale, admins are usually not prepared to take action on random GPU events. Typically, applications experiencing GPU issues have to be removed from the job queue, impacting productivity. Moreover, in some cases admins do not know what actions to take upon certain alerts, so they need a way to automate the right set of actions for specific failures and system events.
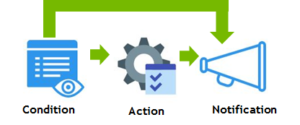
DCGM provides a policy framework (Figure 1) that helps automate recovery actions upon failures, manage configuration policies across a group of GPUs, or control power and clock policies for certain system events. DCGM can be configured to notify a client when certain target conditions are met. The client can register with DCGM through appropriate API calls to receive notifications via callbacks. By using a combination of conditions and action policies, DCGM can be used to trigger automatic GPU behavior in response to different situations. One example of this is automating the GPU page retirement process.
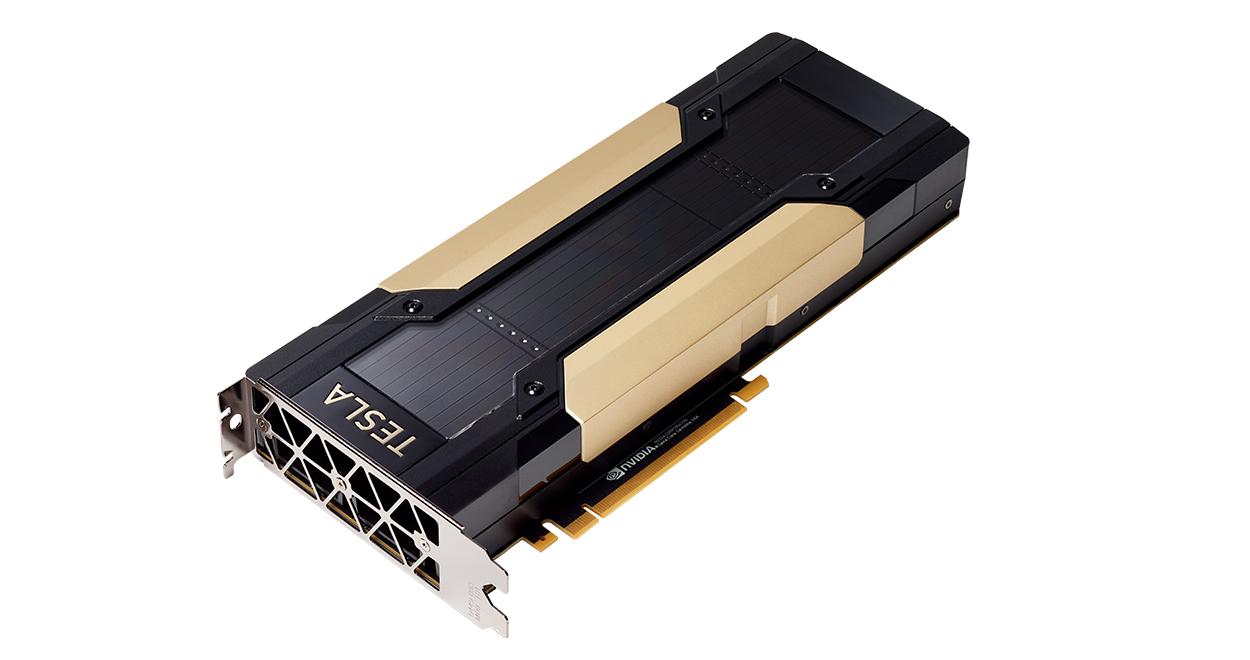
A quick background on page retirement: the NVIDIA driver supports “retiring” bad memory cells, by retiring the page the cell belongs to. This is called “dynamic page retirement” and is done automatically for cells that are degrading in quality. This feature can improve the longevity of an otherwise good board and and is thus an important resiliency feature for data center focused products such as Tesla. In order to take advantage of this feature, admins today have to manually monitor ECC status and manually reset the device when ECC errors are reported so that the page retirement action is taken. This involves a significant number of manual steps.
Using DCGM, admins can take advantage of a preconfigured policy that automatically detects single- and double-bit (DBE) ECC errors, performs page retirement, resets the GPU device and notifies users.
For example, to configure DCGM to re-initialize the GPU after an ECC DBE error:
dcgmi policy --eccerrors --set 1,0
Policy successfully set.
To configure DCGM to reset the GPU and then launch an extensive diagnostic after an ECC DBE error:
dcgmi policy --eccerrors --set 1,3
Policy successfully set.
A DCGM policy can be configured to get an alert upon certain conditions or system events. These can be useful to watch or debug a particular problem. The following is an example of a notification policy for PCIe events.
#dcgmi policy -g 2 --get --verbose
Policy information
+---------------------------+----------------------------------------+
| GPU ID: 0                 | Policy Information                     |
+===========================+========================================+
| Violation conditions      | PCI errors and replays                 |
| Isolation mode            | Manual                                 |
| Action on violation       | None                                   |
| Validation after action   | None                                   |
| Validation failure action | None                                   |
+---------------------------+----------------------------------------+

+---------------------------+----------------------------------------+
| GPU ID: 1                 | Policy Information                     |
+===========================+========================================+
| Violation conditions      | PCI errors and replays                 |
| Isolation mode            | Manual                                 |
| Action on violation       | None                                   |
| Validation after action   | None                                   |
| Validation failure action | None                                   |
+---------------------------+----------------------------------------+
Other examples of user-configurable policies include kicking off diagnostic checks upon application failures, performance degradations, or periodically (e.g. once every 24 hours). Policies can also apply a power cap or restrict clocks if they detect GPUs crossing user-defined power thresholds.
Power and Clock Management
Today’s data centers are power-constrained, and IT admins are always looking for ways to increase performance within a given power envelope. These constraints often trickle down into a fixed power budget for a rack unit and a server. DCGM can be used to dynamically cap the power for a single GPU or a group of GPUs to drive lower power density when needed. Power capping sets the maximum allowed power to the GPUs. When the total board power target is set (Enforced Power Limit) , the GPU driver periodically monitors the power draw, and when the limit is crossed it automatically throttles clocks (and thus voltage) to stay under the power limit. If the GPU is drawing power under the assigned cap, there is no change.
DCGM extends the NVIDIA GPU Boost automatic clock boost feature from a single GPU to a group of GPUs to maximize performance in GPU dense configurations. The auto boost option today modulates a single GPU’s clocks to optimize performance whenever there is power headroom. However, in multi-GPU configurations, boosting a single GPU clock can affect performance for applications that rely on predictable clock behavior for the GPU group. The synchronous boost feature in DCGM dynamically modulates multi-GPU clocks in unison across multiple GPU boards, based on the target workload, power budget and other criteria.
Configuration and Reporting
In large-scale data center deployments there are multiple GPUs per host, and often multiple hosts per job. In these scenarios, there is a strong desire to ensure homogeneity of behaviors across resources, even as specific expectations may change from job to job or user to user, and even as multiple jobs may use resources on the same host simultaneously. DCGM allows group configurations that can be managed by admins to match the requirements of particular environments or applications. These include performance characteristics like clock settings, exclusivity constraints like compute mode, and environmental controls like power limits. DCGM provides enforcement and persistence mechanisms to ensure behavioral consistency across related GPUs. DCGM also determines the optimal default configurations for the GPU group. The following is an example of identifying configured GPU groups and performing a query operation.
# dcgmi discovery -l
2 GPUs found.
+--------+-----------------------------------------------------------+
| GPU ID | Device Information                                        |
+========+===========================================================+
| 0      | Name: Tesla K80                                           |
|        | PCI Bus ID: 0000:07:00.0                                  |
|        | Device UUID: GPU-000000000000000000000000000000000000     |
+--------+-----------------------------------------------------------+
| 1      | Name: Tesla K80                                           |
|        | PCI Bus ID: 0000:08:00.0                                  |
|        | Device UUID: GPU-111111111111111111111111111111111111     |
+--------+-----------------------------------------------------------+
# dcgmi group -g 1 -a 0,1
Add to group operation successful.
# dcgmi group -g 1 -i
+--------------------------------------------------------------------+
| GROUPS     |                                                       |
+============+=======================================================+
| Group ID   | 1                                                     |
| Group Name | GPU_Group                                             |
| GPU ID(s)  | 0, 1                                                  |
+------------+-------------------------------------------------------+
Understanding job-level GPU usage and accounting is important for schedulers and IT admins. Correlating GPU usage with system performance, events and key telemetry, especially at the boundaries of a workload, is valuable in explaining job behavior, identifying opportunities to drive utilization and efficiencies, and determining root causes of potential issues. DCGM provides mechanisms to gather, group and analyze stats at the job level, as the following example shows.
dcgmi stats --job demojob -v -g 2
Successfully retrieved statistics for job: demojob.
+-----------------------------------------------------------------------+
| GPU ID: 0                                                             |
+===============================+=======================================+
|-----  Execution Stats  -------+---------------------------------------|
| Start Time                    | Wed Mar  9 15:07:34 2016              |
| End Time                      | Wed Mar  9 15:08:00 2016              |
| Total Execution Time (sec)    | 25.48                                 |
| No. of Processes              | 1                                     |
| Compute PID                   | 23112                                 |
+-----  Performance Stats  -----+---------------------------------------+
| Energy Consumed (Joules)      | 1437                                  |
| Max GPU Memory Used (bytes)   | 120324096                             |
| SM Clock (MHz)                | Avg: 998, Max: 1177, Min: 405         |
| Memory Clock (MHz)            | Avg: 2068, Max: 2505, Min: 324        |
| SM Utilization (%)            | Avg: 76, Max: 100, Min: 0             |
| Memory Utilization (%)        | Avg: 0, Max: 1, Min: 0                |
| PCIe Rx Bandwidth (megabytes) | Avg: 0, Max: 0, Min: 0                |
| PCIe Tx Bandwidth (megabytes) | Avg: 0, Max: 0, Min: 0                |
+-----  Event Stats  -----------+---------------------------------------+
| Single Bit ECC Errors         | 0                                     |
| Double Bit ECC Errors         | 0                                     |
| PCIe Replay Warnings          | 0                                     |
| Critical XID Errors           | 0                                     |
+-----  Slowdown Stats  --------+---------------------------------------+
| Due to - Power (%)            | 0                                     |
|       - Thermal (%)           | Not Supported                         |
|       - Reliability (%)       | Not Supported                         |
|       - Board Limit (%)       | Not Supported                         |
|       - Low Utilization (%)   | Not Supported                         |
|       - Sync Boost (%)        | 0                                     |
+-------------------------------+---------------------------------------+
DCGM Integration with ISV Management Solutions
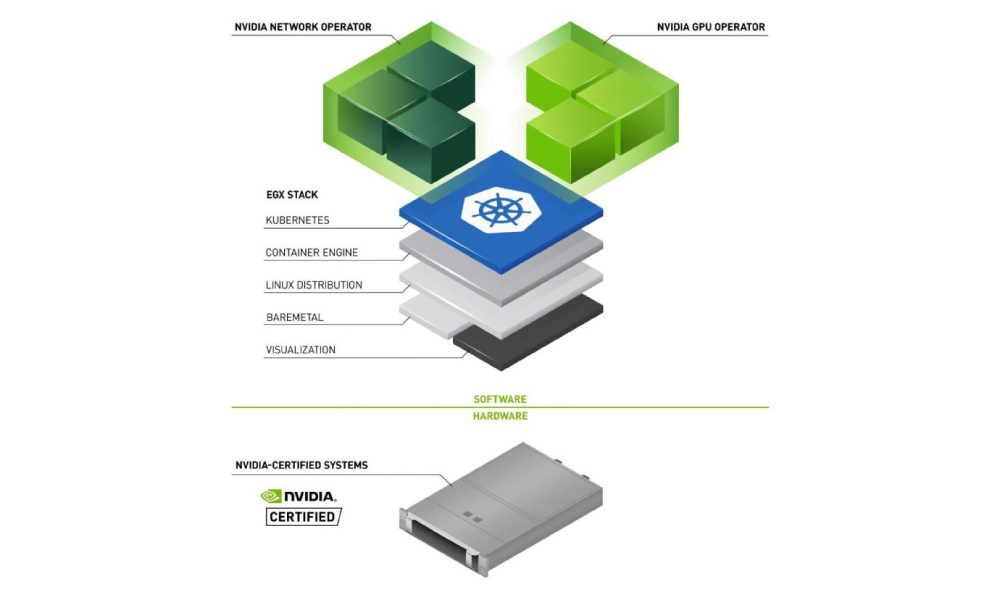
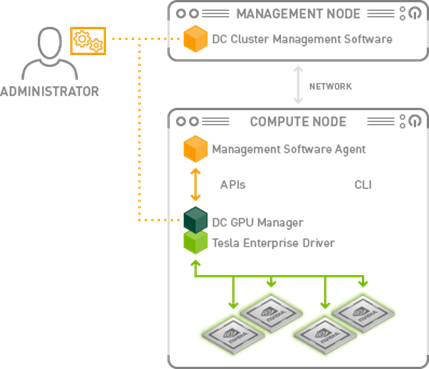
Over the last several months, NVIDIA has worked closely with ISV partners to integrate DCGM into industry-leading cluster and workload management solutions. This integration will provide IT admins with richer GPU management capabilities, improved UI experience, and higher throughput and resiliency with optimized job scheduling. By embedding DCGM into datacenter management solutions, ISVs can lower the overall system jitter associated with running multiple monitoring agents, and provide quicker responses to system events. Figure 7 shows a possible deployment architecture for DCGM in the data center.
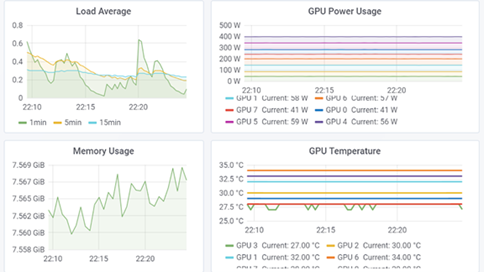
Bright Cluster Manager™ version 8.0, expected early next year, will include DCGM support, expanding its GPU management to the next level. With the integration of DCGM, Bright Cluster Manager will plot graphs of GPU metrics at much higher accuracy, and seamlessly correlate job statistics with system-level metrics. In addition, Bright Cluster Manager will provide non-invasive health checks while jobs are running as well as deep GPU diagnostics available to administrators through Bright’s burn-in environment, used for cluster validation during infrastructure refresh.
Altair PBS Professional ® HPC workload management software now provides DCGM integration, offering the following key new functionality:
- Pre-job node risk identification and GPU resource allocation;
- Automated monitoring of node health;
- Reduced job terminations due to GPU failures;
- Increased system resilience via intelligent routing decisions;
- Increased job throughput via topology optimization;
- Optimized job scheduling through GPU load and health monitoring.
IBM® Spectrum LSF™ provides extensive support for NVIDIA GPUs and is adding support for DCGM. The next release of LSF version 10.1 with DCGM integration will enable the following capabilities:
- Intelligent topology aware job placement of applications onto healthy GPU’s
- Monitoring of GPU health
- CPU-GPU Affinity
- GPU Power Management and support for synchronous boost.
- Integrated GPU accounting
Conclusion
DCGM offers a comprehensive suite of enterprise-grade tools for managing the accelerated data center. IT managers now have the power to actively monitor GPU cluster-level health and reliability, make GPU management transparent with low overhead, quickly detect and diagnose system events and maximize data center throughput. Managing and monitoring the accelerated data center has never been easier. DCGM 1.0 Release Candidate is available now. To get started with DCGM, sign up and download DCGM today!